Croatian vs Immigrants from Scotland Single Mother Poverty
COMPARE
Croatian
Immigrants from Scotland
Single Mother Poverty
Single Mother Poverty Comparison
Croatians
Immigrants from Scotland
28.2%
SINGLE MOTHER POVERTY
94.8/ 100
METRIC RATING
110th/ 347
METRIC RANK
27.6%
SINGLE MOTHER POVERTY
98.9/ 100
METRIC RATING
81st/ 347
METRIC RANK
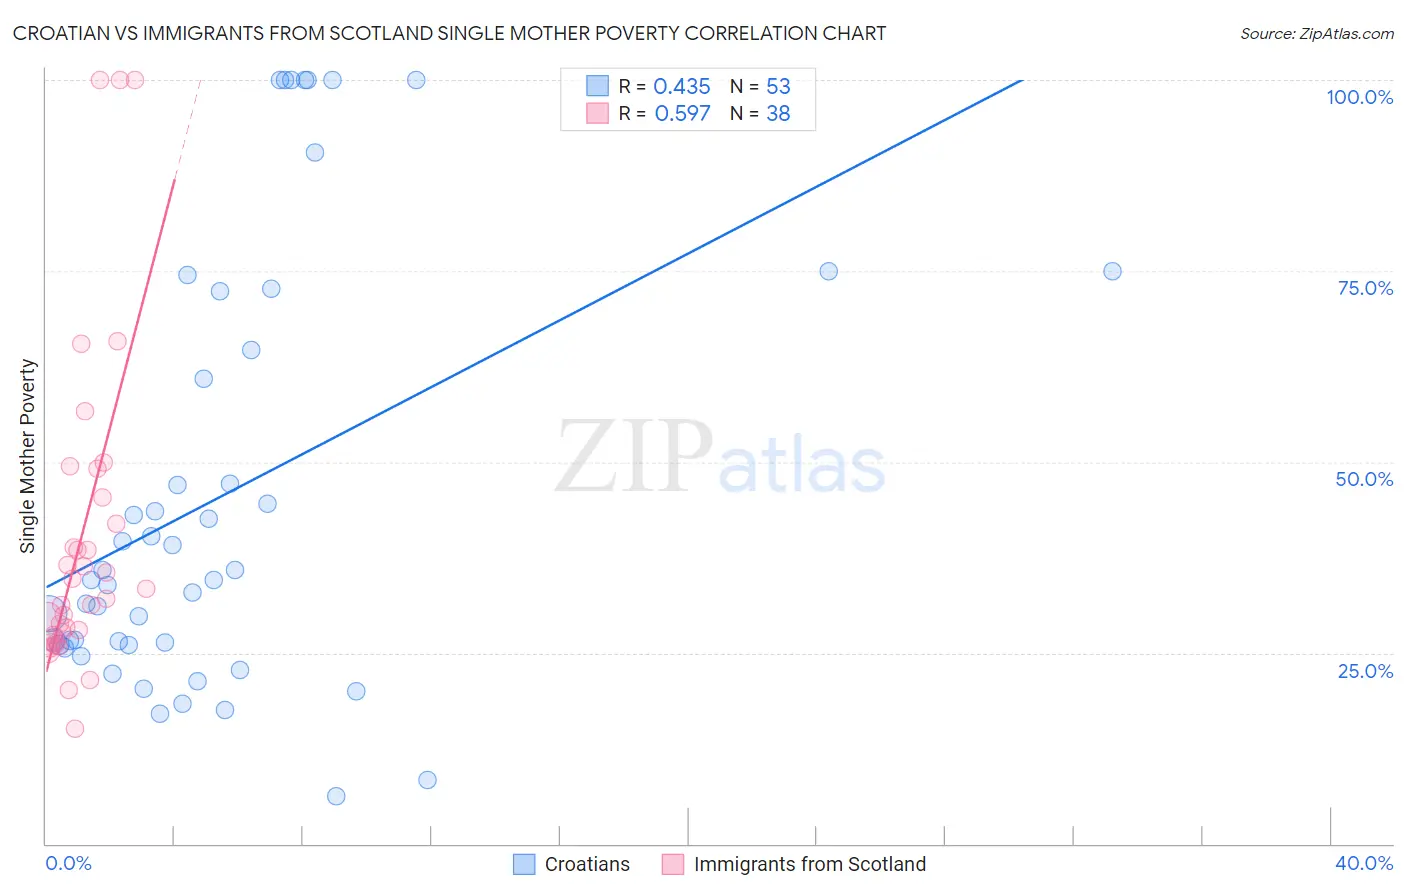
Croatian vs Immigrants from Scotland Single Mother Poverty Correlation Chart
The statistical analysis conducted on geographies consisting of 364,805,698 people shows a moderate positive correlation between the proportion of Croatians and poverty level among single mothers in the United States with a correlation coefficient (R) of 0.435 and weighted average of 28.2%. Similarly, the statistical analysis conducted on geographies consisting of 192,448,213 people shows a substantial positive correlation between the proportion of Immigrants from Scotland and poverty level among single mothers in the United States with a correlation coefficient (R) of 0.597 and weighted average of 27.6%, a difference of 2.0%.
Single Mother Poverty Correlation Summary
| Measurement | Croatian | Immigrants from Scotland |
| Minimum | 6.2% | 15.0% |
| Maximum | 100.0% | 100.0% |
| Range | 93.8% | 85.0% |
| Mean | 45.5% | 40.1% |
| Median | 34.6% | 32.7% |
| Interquartile 25% (IQ1) | 26.0% | 27.4% |
| Interquartile 75% (IQ3) | 68.5% | 45.3% |
| Interquartile Range (IQR) | 42.5% | 17.9% |
| Standard Deviation (Sample) | 28.0% | 21.1% |
| Standard Deviation (Population) | 27.7% | 20.8% |
Similar Demographics by Single Mother Poverty
Demographics Similar to Croatians by Single Mother Poverty
In terms of single mother poverty, the demographic groups most similar to Croatians are Venezuelan (28.2%, a difference of 0.050%), Immigrants from Kazakhstan (28.2%, a difference of 0.060%), Immigrants from Armenia (28.1%, a difference of 0.12%), Immigrants from Zimbabwe (28.1%, a difference of 0.21%), and Immigrants from Venezuela (28.1%, a difference of 0.29%).
| Demographics | Rating | Rank | Single Mother Poverty |
| Immigrants | Northern Africa | 96.6 /100 | #103 | Exceptional 28.0% |
| Italians | 96.6 /100 | #104 | Exceptional 28.0% |
| Israelis | 96.5 /100 | #105 | Exceptional 28.0% |
| Ukrainians | 96.4 /100 | #106 | Exceptional 28.0% |
| Immigrants | Venezuela | 95.8 /100 | #107 | Exceptional 28.1% |
| Immigrants | Zimbabwe | 95.5 /100 | #108 | Exceptional 28.1% |
| Immigrants | Armenia | 95.2 /100 | #109 | Exceptional 28.1% |
| Croatians | 94.8 /100 | #110 | Exceptional 28.2% |
| Venezuelans | 94.5 /100 | #111 | Exceptional 28.2% |
| Immigrants | Kazakhstan | 94.5 /100 | #112 | Exceptional 28.2% |
| Immigrants | South Africa | 93.2 /100 | #113 | Exceptional 28.3% |
| Immigrants | Western Asia | 92.7 /100 | #114 | Exceptional 28.3% |
| Immigrants | Kuwait | 92.7 /100 | #115 | Exceptional 28.3% |
| Immigrants | Uganda | 92.5 /100 | #116 | Exceptional 28.3% |
| Australians | 92.5 /100 | #117 | Exceptional 28.3% |
Demographics Similar to Immigrants from Scotland by Single Mother Poverty
In terms of single mother poverty, the demographic groups most similar to Immigrants from Scotland are Immigrants from Cameroon (27.6%, a difference of 0.12%), Greek (27.7%, a difference of 0.18%), Immigrants from Latvia (27.7%, a difference of 0.21%), Mongolian (27.7%, a difference of 0.21%), and Immigrants from Ukraine (27.7%, a difference of 0.30%).
| Demographics | Rating | Rank | Single Mother Poverty |
| Immigrants | Europe | 99.3 /100 | #74 | Exceptional 27.4% |
| Immigrants | Sweden | 99.2 /100 | #75 | Exceptional 27.5% |
| Peruvians | 99.2 /100 | #76 | Exceptional 27.5% |
| Immigrants | Peru | 99.2 /100 | #77 | Exceptional 27.5% |
| Immigrants | North Macedonia | 99.2 /100 | #78 | Exceptional 27.5% |
| Immigrants | Italy | 99.1 /100 | #79 | Exceptional 27.5% |
| Taiwanese | 99.1 /100 | #80 | Exceptional 27.5% |
| Immigrants | Scotland | 98.9 /100 | #81 | Exceptional 27.6% |
| Immigrants | Cameroon | 98.8 /100 | #82 | Exceptional 27.6% |
| Greeks | 98.7 /100 | #83 | Exceptional 27.7% |
| Immigrants | Latvia | 98.7 /100 | #84 | Exceptional 27.7% |
| Mongolians | 98.7 /100 | #85 | Exceptional 27.7% |
| Immigrants | Ukraine | 98.6 /100 | #86 | Exceptional 27.7% |
| Afghans | 98.5 /100 | #87 | Exceptional 27.7% |
| Ethiopians | 98.4 /100 | #88 | Exceptional 27.7% |