Maltese vs Comanche Single Mother Poverty
COMPARE
Maltese
Comanche
Single Mother Poverty
Single Mother Poverty Comparison
Maltese
Comanche
26.6%
SINGLE MOTHER POVERTY
99.9/ 100
METRIC RATING
35th/ 347
METRIC RANK
33.9%
SINGLE MOTHER POVERTY
0.0/ 100
METRIC RATING
307th/ 347
METRIC RANK
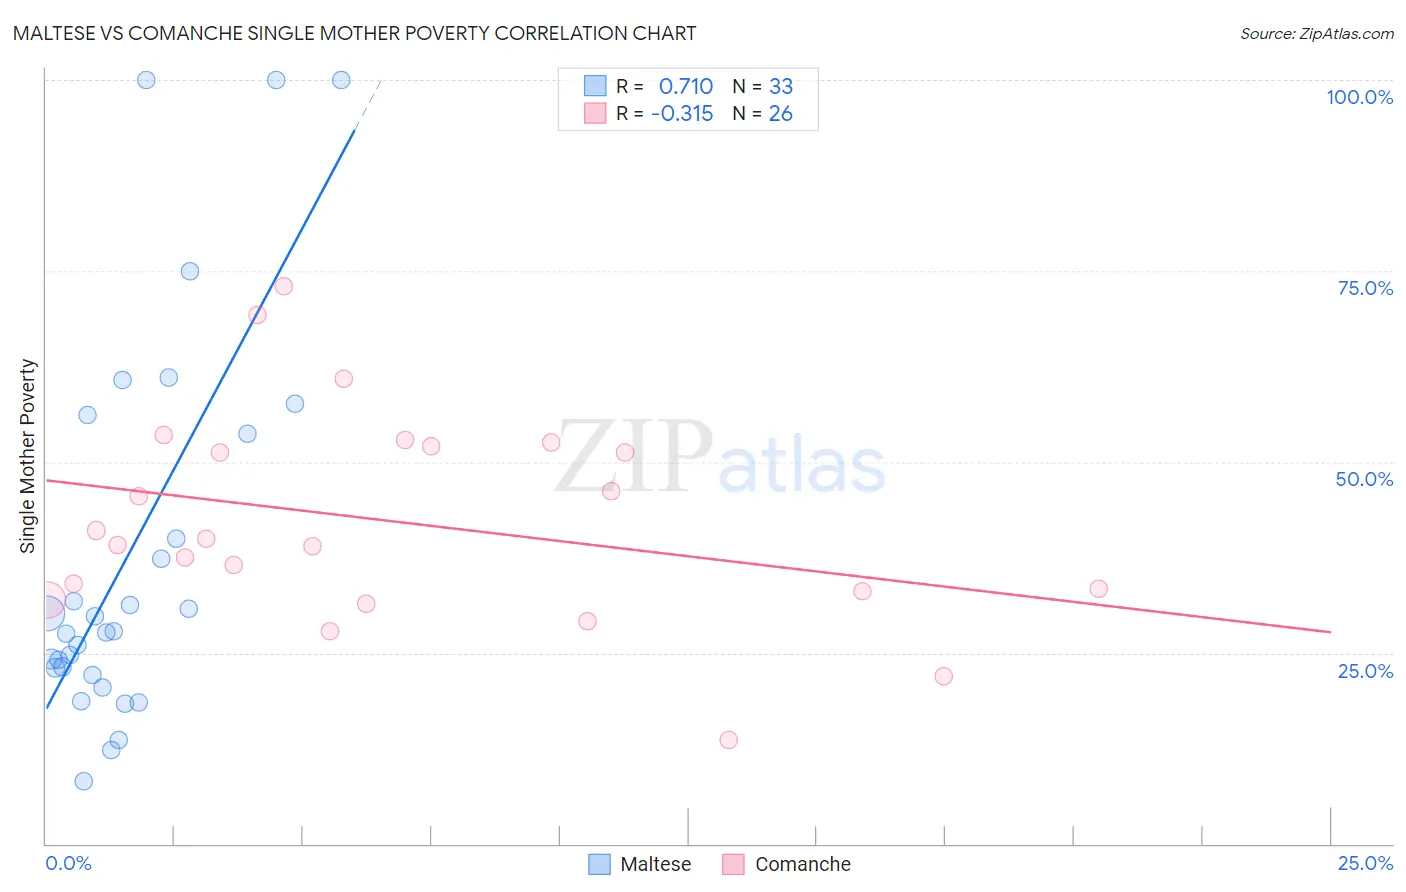
Maltese vs Comanche Single Mother Poverty Correlation Chart
The statistical analysis conducted on geographies consisting of 124,400,291 people shows a strong positive correlation between the proportion of Maltese and poverty level among single mothers in the United States with a correlation coefficient (R) of 0.710 and weighted average of 26.6%. Similarly, the statistical analysis conducted on geographies consisting of 109,063,480 people shows a mild negative correlation between the proportion of Comanche and poverty level among single mothers in the United States with a correlation coefficient (R) of -0.315 and weighted average of 33.9%, a difference of 27.6%.
Single Mother Poverty Correlation Summary
| Measurement | Maltese | Comanche |
| Minimum | 8.2% | 13.6% |
| Maximum | 100.0% | 73.0% |
| Range | 91.8% | 59.3% |
| Mean | 38.1% | 42.2% |
| Median | 27.8% | 39.6% |
| Interquartile 25% (IQ1) | 22.6% | 33.1% |
| Interquartile 75% (IQ3) | 54.9% | 52.0% |
| Interquartile Range (IQR) | 32.3% | 18.9% |
| Standard Deviation (Sample) | 25.3% | 13.9% |
| Standard Deviation (Population) | 24.9% | 13.6% |
Similar Demographics by Single Mother Poverty
Demographics Similar to Maltese by Single Mother Poverty
In terms of single mother poverty, the demographic groups most similar to Maltese are Okinawan (26.6%, a difference of 0.050%), Immigrants from Israel (26.6%, a difference of 0.050%), Immigrants from Fiji (26.6%, a difference of 0.090%), Immigrants from Indonesia (26.6%, a difference of 0.12%), and Bulgarian (26.5%, a difference of 0.13%).
| Demographics | Rating | Rank | Single Mother Poverty |
| Koreans | 100.0 /100 | #28 | Exceptional 26.4% |
| Jordanians | 100.0 /100 | #29 | Exceptional 26.4% |
| Turks | 100.0 /100 | #30 | Exceptional 26.4% |
| Immigrants | Philippines | 100.0 /100 | #31 | Exceptional 26.5% |
| Tongans | 99.9 /100 | #32 | Exceptional 26.5% |
| Bulgarians | 99.9 /100 | #33 | Exceptional 26.5% |
| Immigrants | Indonesia | 99.9 /100 | #34 | Exceptional 26.6% |
| Maltese | 99.9 /100 | #35 | Exceptional 26.6% |
| Okinawans | 99.9 /100 | #36 | Exceptional 26.6% |
| Immigrants | Israel | 99.9 /100 | #37 | Exceptional 26.6% |
| Immigrants | Fiji | 99.9 /100 | #38 | Exceptional 26.6% |
| Sri Lankans | 99.9 /100 | #39 | Exceptional 26.7% |
| Immigrants | Vietnam | 99.9 /100 | #40 | Exceptional 26.7% |
| Immigrants | Greece | 99.9 /100 | #41 | Exceptional 26.7% |
| Armenians | 99.9 /100 | #42 | Exceptional 26.8% |
Demographics Similar to Comanche by Single Mother Poverty
In terms of single mother poverty, the demographic groups most similar to Comanche are Immigrants from Mexico (34.0%, a difference of 0.18%), Immigrants from Congo (33.8%, a difference of 0.41%), Potawatomi (34.1%, a difference of 0.60%), Honduran (34.2%, a difference of 0.82%), and Immigrants from Central America (33.6%, a difference of 1.1%).
| Demographics | Rating | Rank | Single Mother Poverty |
| Hispanics or Latinos | 0.0 /100 | #300 | Tragic 33.3% |
| Immigrants | Somalia | 0.0 /100 | #301 | Tragic 33.4% |
| Arapaho | 0.0 /100 | #302 | Tragic 33.4% |
| Americans | 0.0 /100 | #303 | Tragic 33.5% |
| Mexicans | 0.0 /100 | #304 | Tragic 33.6% |
| Immigrants | Central America | 0.0 /100 | #305 | Tragic 33.6% |
| Immigrants | Congo | 0.0 /100 | #306 | Tragic 33.8% |
| Comanche | 0.0 /100 | #307 | Tragic 33.9% |
| Immigrants | Mexico | 0.0 /100 | #308 | Tragic 34.0% |
| Potawatomi | 0.0 /100 | #309 | Tragic 34.1% |
| Hondurans | 0.0 /100 | #310 | Tragic 34.2% |
| Alsatians | 0.0 /100 | #311 | Tragic 34.3% |
| Central American Indians | 0.0 /100 | #312 | Tragic 34.3% |
| Immigrants | Dominican Republic | 0.0 /100 | #313 | Tragic 34.4% |
| Chickasaw | 0.0 /100 | #314 | Tragic 34.4% |