Costa Rican vs Immigrants from Dominican Republic Female Poverty
COMPARE
Costa Rican
Immigrants from Dominican Republic
Female Poverty
Female Poverty Comparison
Costa Ricans
Immigrants from Dominican Republic
13.3%
FEMALE POVERTY
63.6/ 100
METRIC RATING
159th/ 347
METRIC RANK
19.3%
FEMALE POVERTY
0.0/ 100
METRIC RATING
333rd/ 347
METRIC RANK
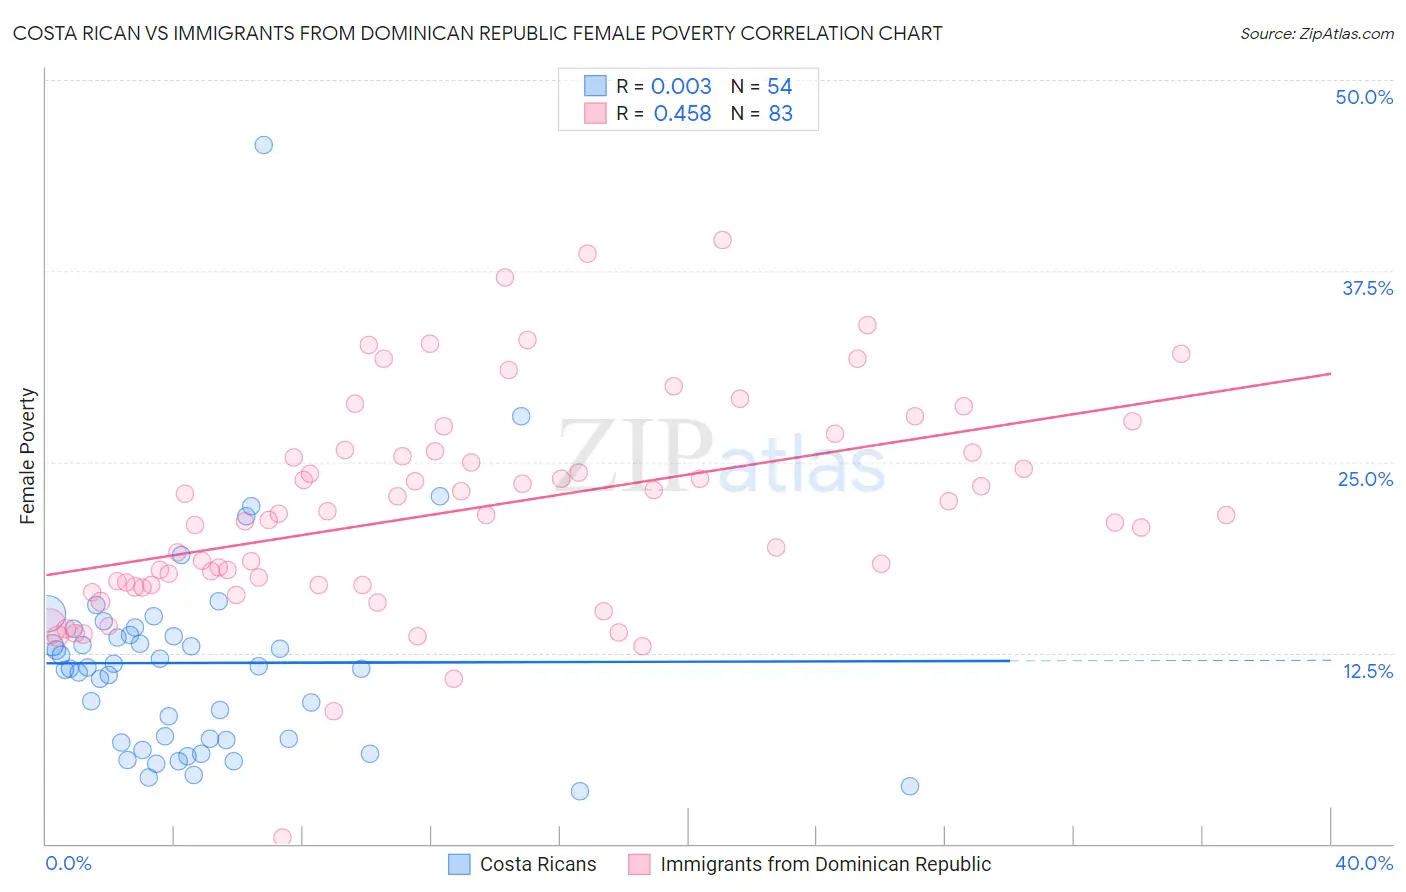
Costa Rican vs Immigrants from Dominican Republic Female Poverty Correlation Chart
The statistical analysis conducted on geographies consisting of 253,437,784 people shows no correlation between the proportion of Costa Ricans and poverty level among females in the United States with a correlation coefficient (R) of 0.003 and weighted average of 13.3%. Similarly, the statistical analysis conducted on geographies consisting of 274,906,284 people shows a moderate positive correlation between the proportion of Immigrants from Dominican Republic and poverty level among females in the United States with a correlation coefficient (R) of 0.458 and weighted average of 19.3%, a difference of 45.9%.
Female Poverty Correlation Summary
| Measurement | Costa Rican | Immigrants from Dominican Republic |
| Minimum | 3.4% | 0.39% |
| Maximum | 45.8% | 39.5% |
| Range | 42.4% | 39.1% |
| Mean | 11.8% | 21.9% |
| Median | 11.5% | 21.5% |
| Interquartile 25% (IQ1) | 6.8% | 17.0% |
| Interquartile 75% (IQ3) | 13.6% | 25.7% |
| Interquartile Range (IQR) | 6.8% | 8.7% |
| Standard Deviation (Sample) | 7.0% | 7.0% |
| Standard Deviation (Population) | 6.9% | 7.0% |
Similar Demographics by Female Poverty
Demographics Similar to Costa Ricans by Female Poverty
In terms of female poverty, the demographic groups most similar to Costa Ricans are Immigrants from Nepal (13.3%, a difference of 0.090%), Immigrants from Ethiopia (13.3%, a difference of 0.12%), Guamanian/Chamorro (13.3%, a difference of 0.12%), Immigrants from Albania (13.3%, a difference of 0.13%), and Ethiopian (13.3%, a difference of 0.14%).
| Demographics | Rating | Rank | Female Poverty |
| Samoans | 73.6 /100 | #152 | Good 13.1% |
| Immigrants | Fiji | 71.0 /100 | #153 | Good 13.2% |
| Armenians | 70.4 /100 | #154 | Good 13.2% |
| Hungarians | 70.1 /100 | #155 | Good 13.2% |
| Immigrants | Bosnia and Herzegovina | 69.7 /100 | #156 | Good 13.2% |
| Immigrants | Northern Africa | 68.8 /100 | #157 | Good 13.2% |
| Pennsylvania Germans | 67.3 /100 | #158 | Good 13.2% |
| Costa Ricans | 63.6 /100 | #159 | Good 13.3% |
| Immigrants | Nepal | 62.7 /100 | #160 | Good 13.3% |
| Immigrants | Ethiopia | 62.5 /100 | #161 | Good 13.3% |
| Guamanians/Chamorros | 62.4 /100 | #162 | Good 13.3% |
| Immigrants | Albania | 62.4 /100 | #163 | Good 13.3% |
| Ethiopians | 62.3 /100 | #164 | Good 13.3% |
| Scotch-Irish | 62.1 /100 | #165 | Good 13.3% |
| Immigrants | Oceania | 59.7 /100 | #166 | Average 13.3% |
Demographics Similar to Immigrants from Dominican Republic by Female Poverty
In terms of female poverty, the demographic groups most similar to Immigrants from Dominican Republic are Apache (19.2%, a difference of 0.60%), Native/Alaskan (19.2%, a difference of 0.76%), Dominican (19.1%, a difference of 1.2%), Houma (20.0%, a difference of 3.6%), and Kiowa (18.6%, a difference of 3.9%).
| Demographics | Rating | Rank | Female Poverty |
| Central American Indians | 0.0 /100 | #326 | Tragic 18.0% |
| Yakama | 0.0 /100 | #327 | Tragic 18.0% |
| Blacks/African Americans | 0.0 /100 | #328 | Tragic 18.6% |
| Kiowa | 0.0 /100 | #329 | Tragic 18.6% |
| Dominicans | 0.0 /100 | #330 | Tragic 19.1% |
| Natives/Alaskans | 0.0 /100 | #331 | Tragic 19.2% |
| Apache | 0.0 /100 | #332 | Tragic 19.2% |
| Immigrants | Dominican Republic | 0.0 /100 | #333 | Tragic 19.3% |
| Houma | 0.0 /100 | #334 | Tragic 20.0% |
| Cheyenne | 0.0 /100 | #335 | Tragic 20.2% |
| Pueblo | 0.0 /100 | #336 | Tragic 20.7% |
| Yuman | 0.0 /100 | #337 | Tragic 20.8% |
| Sioux | 0.0 /100 | #338 | Tragic 20.9% |
| Hopi | 0.0 /100 | #339 | Tragic 21.0% |
| Yup'ik | 0.0 /100 | #340 | Tragic 21.5% |