Costa Rican vs Immigrants from Dominican Republic Median Earnings
COMPARE
Costa Rican
Immigrants from Dominican Republic
Median Earnings
Median Earnings Comparison
Costa Ricans
Immigrants from Dominican Republic
$46,645
MEDIAN EARNINGS
57.4/ 100
METRIC RATING
167th/ 347
METRIC RANK
$41,554
MEDIAN EARNINGS
0.1/ 100
METRIC RATING
288th/ 347
METRIC RANK
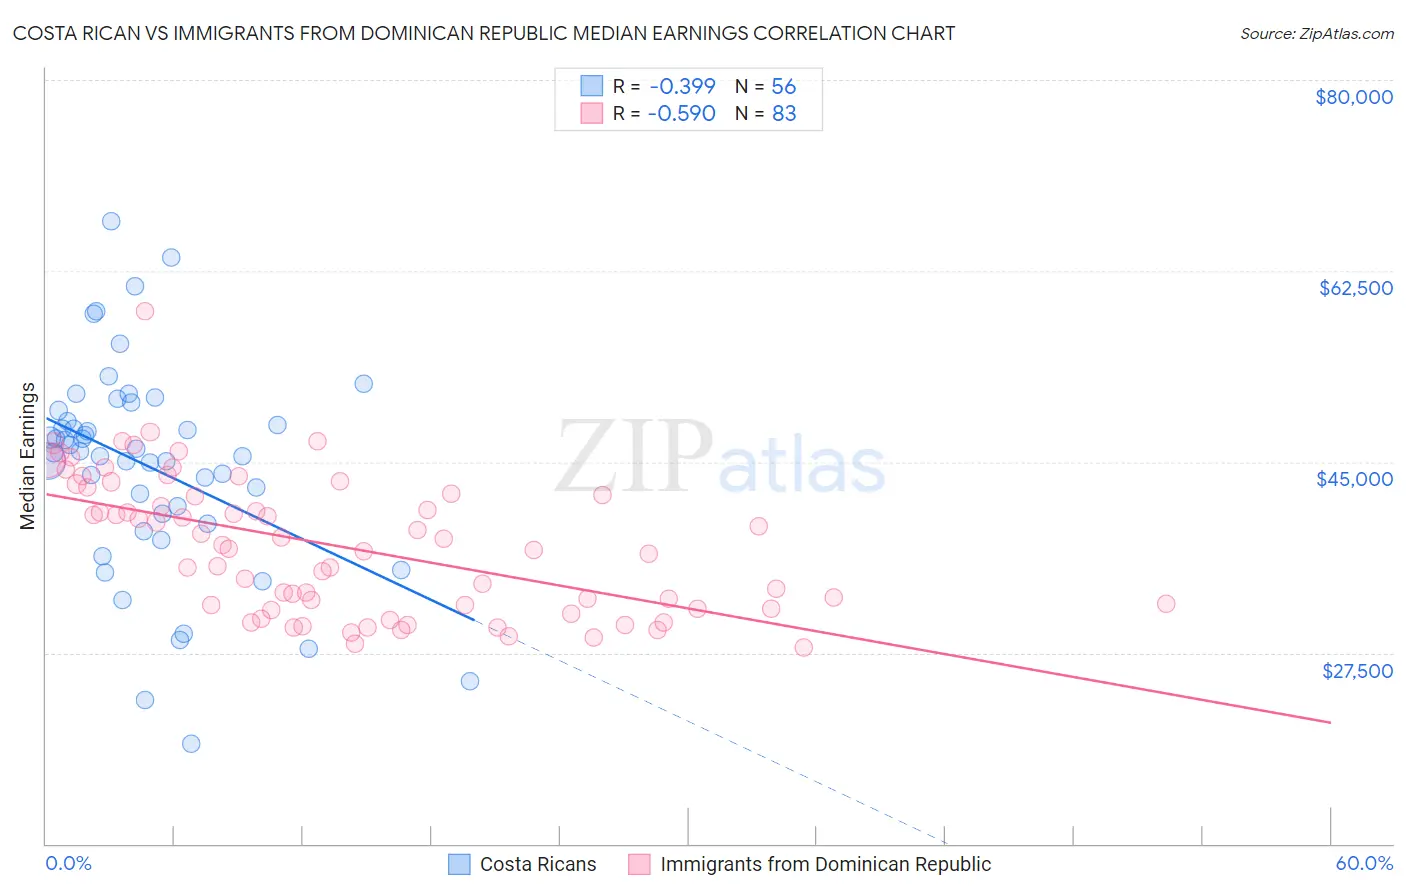
Costa Rican vs Immigrants from Dominican Republic Median Earnings Correlation Chart
The statistical analysis conducted on geographies consisting of 253,579,984 people shows a mild negative correlation between the proportion of Costa Ricans and median earnings in the United States with a correlation coefficient (R) of -0.399 and weighted average of $46,645. Similarly, the statistical analysis conducted on geographies consisting of 275,134,235 people shows a substantial negative correlation between the proportion of Immigrants from Dominican Republic and median earnings in the United States with a correlation coefficient (R) of -0.590 and weighted average of $41,554, a difference of 12.2%.
Median Earnings Correlation Summary
| Measurement | Costa Rican | Immigrants from Dominican Republic |
| Minimum | $19,205 | $28,009 |
| Maximum | $67,102 | $58,780 |
| Range | $47,897 | $30,771 |
| Mean | $44,542 | $37,276 |
| Median | $45,923 | $37,042 |
| Interquartile 25% (IQ1) | $39,792 | $31,535 |
| Interquartile 75% (IQ3) | $49,211 | $42,082 |
| Interquartile Range (IQR) | $9,420 | $10,547 |
| Standard Deviation (Sample) | $9,601 | $6,269 |
| Standard Deviation (Population) | $9,515 | $6,231 |
Similar Demographics by Median Earnings
Demographics Similar to Costa Ricans by Median Earnings
In terms of median earnings, the demographic groups most similar to Costa Ricans are Czechoslovakian ($46,658, a difference of 0.030%), Immigrants from Africa ($46,564, a difference of 0.17%), Immigrants from South America ($46,548, a difference of 0.21%), South American ($46,804, a difference of 0.34%), and Immigrants ($46,478, a difference of 0.36%).
| Demographics | Rating | Rank | Median Earnings |
| Alsatians | 69.6 /100 | #160 | Good $47,023 |
| Immigrants | Eastern Africa | 68.0 /100 | #161 | Good $46,969 |
| South American Indians | 67.4 /100 | #162 | Good $46,952 |
| Icelanders | 66.3 /100 | #163 | Good $46,916 |
| Norwegians | 64.7 /100 | #164 | Good $46,865 |
| South Americans | 62.7 /100 | #165 | Good $46,804 |
| Czechoslovakians | 57.8 /100 | #166 | Average $46,658 |
| Costa Ricans | 57.4 /100 | #167 | Average $46,645 |
| Immigrants | Africa | 54.6 /100 | #168 | Average $46,564 |
| Immigrants | South America | 54.0 /100 | #169 | Average $46,548 |
| Immigrants | Immigrants | 51.6 /100 | #170 | Average $46,478 |
| Scottish | 51.1 /100 | #171 | Average $46,463 |
| Kenyans | 51.0 /100 | #172 | Average $46,462 |
| Ghanaians | 50.3 /100 | #173 | Average $46,440 |
| Scandinavians | 50.0 /100 | #174 | Average $46,433 |
Demographics Similar to Immigrants from Dominican Republic by Median Earnings
In terms of median earnings, the demographic groups most similar to Immigrants from Dominican Republic are Comanche ($41,519, a difference of 0.080%), Paiute ($41,508, a difference of 0.11%), Central American Indian ($41,474, a difference of 0.19%), U.S. Virgin Islander ($41,448, a difference of 0.26%), and Indonesian ($41,701, a difference of 0.35%).
| Demographics | Rating | Rank | Median Earnings |
| Marshallese | 0.2 /100 | #281 | Tragic $41,969 |
| Africans | 0.2 /100 | #282 | Tragic $41,955 |
| Dominicans | 0.2 /100 | #283 | Tragic $41,864 |
| Blackfeet | 0.2 /100 | #284 | Tragic $41,822 |
| Immigrants | Nicaragua | 0.1 /100 | #285 | Tragic $41,737 |
| Mexican American Indians | 0.1 /100 | #286 | Tragic $41,719 |
| Indonesians | 0.1 /100 | #287 | Tragic $41,701 |
| Immigrants | Dominican Republic | 0.1 /100 | #288 | Tragic $41,554 |
| Comanche | 0.1 /100 | #289 | Tragic $41,519 |
| Paiute | 0.1 /100 | #290 | Tragic $41,508 |
| Central American Indians | 0.1 /100 | #291 | Tragic $41,474 |
| U.S. Virgin Islanders | 0.1 /100 | #292 | Tragic $41,448 |
| Immigrants | Zaire | 0.1 /100 | #293 | Tragic $41,325 |
| Potawatomi | 0.1 /100 | #294 | Tragic $41,288 |
| Bangladeshis | 0.1 /100 | #295 | Tragic $41,263 |