Immigrants from Eritrea vs Immigrants from Dominican Republic Female Poverty
COMPARE
Immigrants from Eritrea
Immigrants from Dominican Republic
Female Poverty
Female Poverty Comparison
Immigrants from Eritrea
Immigrants from Dominican Republic
14.6%
FEMALE POVERTY
2.4/ 100
METRIC RATING
226th/ 347
METRIC RANK
19.3%
FEMALE POVERTY
0.0/ 100
METRIC RATING
333rd/ 347
METRIC RANK
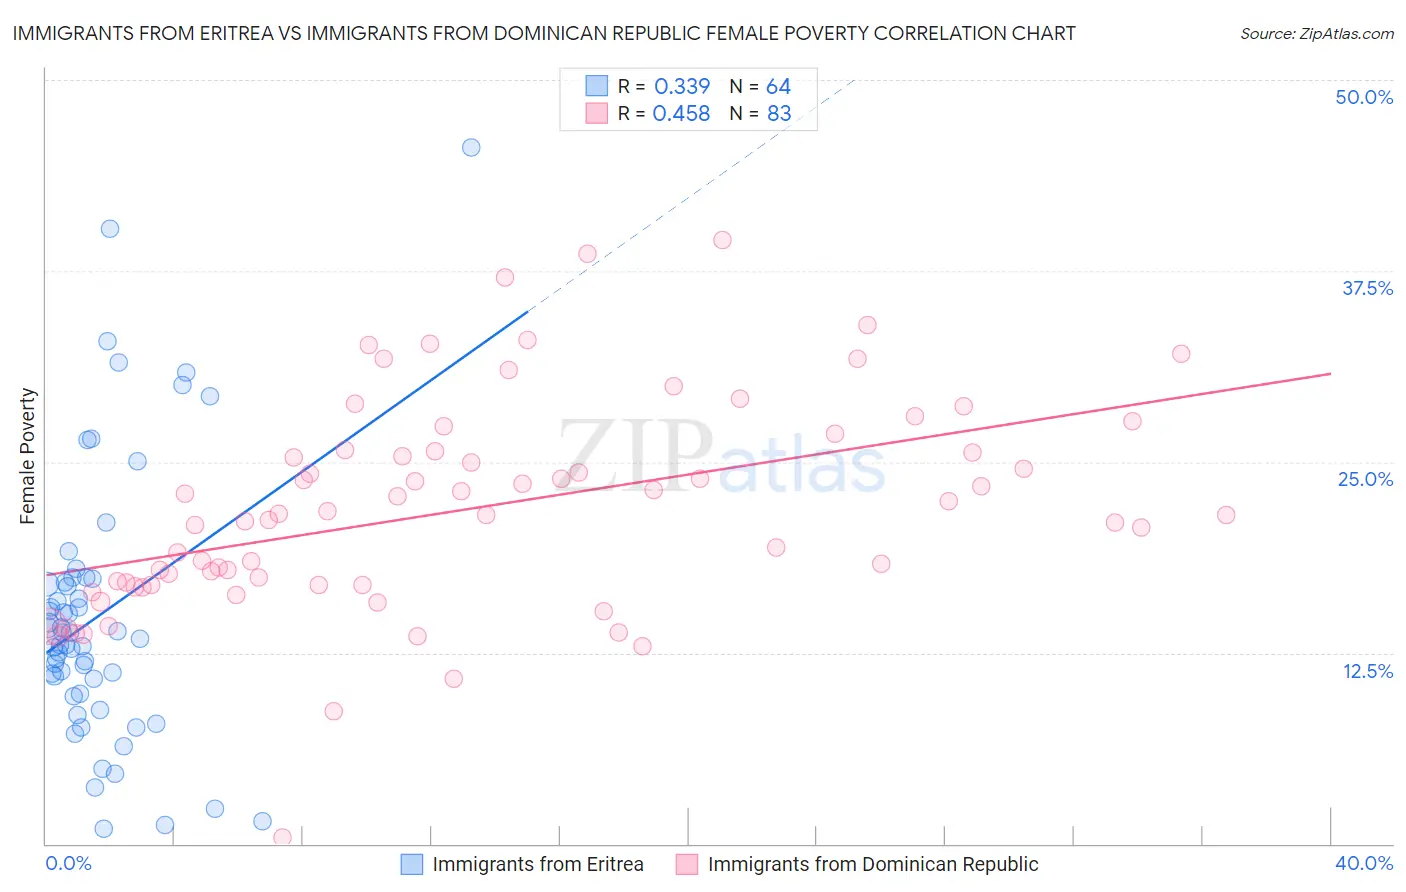
Immigrants from Eritrea vs Immigrants from Dominican Republic Female Poverty Correlation Chart
The statistical analysis conducted on geographies consisting of 104,846,826 people shows a mild positive correlation between the proportion of Immigrants from Eritrea and poverty level among females in the United States with a correlation coefficient (R) of 0.339 and weighted average of 14.6%. Similarly, the statistical analysis conducted on geographies consisting of 274,906,284 people shows a moderate positive correlation between the proportion of Immigrants from Dominican Republic and poverty level among females in the United States with a correlation coefficient (R) of 0.458 and weighted average of 19.3%, a difference of 32.2%.
Female Poverty Correlation Summary
| Measurement | Immigrants from Eritrea | Immigrants from Dominican Republic |
| Minimum | 1.0% | 0.39% |
| Maximum | 45.6% | 39.5% |
| Range | 44.6% | 39.1% |
| Mean | 15.0% | 21.9% |
| Median | 13.6% | 21.5% |
| Interquartile 25% (IQ1) | 10.3% | 17.0% |
| Interquartile 75% (IQ3) | 17.2% | 25.7% |
| Interquartile Range (IQR) | 6.9% | 8.7% |
| Standard Deviation (Sample) | 8.9% | 7.0% |
| Standard Deviation (Population) | 8.8% | 7.0% |
Similar Demographics by Female Poverty
Demographics Similar to Immigrants from Eritrea by Female Poverty
In terms of female poverty, the demographic groups most similar to Immigrants from Eritrea are Immigrants from Nigeria (14.7%, a difference of 0.31%), American (14.6%, a difference of 0.33%), Immigrants from Micronesia (14.6%, a difference of 0.33%), German Russian (14.7%, a difference of 0.45%), and Ghanaian (14.7%, a difference of 0.52%).
| Demographics | Rating | Rank | Female Poverty |
| Japanese | 4.1 /100 | #219 | Tragic 14.5% |
| Alsatians | 4.0 /100 | #220 | Tragic 14.5% |
| Immigrants | Cambodia | 3.7 /100 | #221 | Tragic 14.5% |
| Immigrants | Nonimmigrants | 3.7 /100 | #222 | Tragic 14.5% |
| Immigrants | Africa | 3.3 /100 | #223 | Tragic 14.5% |
| Americans | 2.8 /100 | #224 | Tragic 14.6% |
| Immigrants | Micronesia | 2.8 /100 | #225 | Tragic 14.6% |
| Immigrants | Eritrea | 2.4 /100 | #226 | Tragic 14.6% |
| Immigrants | Nigeria | 2.1 /100 | #227 | Tragic 14.7% |
| German Russians | 2.0 /100 | #228 | Tragic 14.7% |
| Ghanaians | 1.9 /100 | #229 | Tragic 14.7% |
| Alaska Natives | 1.8 /100 | #230 | Tragic 14.7% |
| Nigerians | 1.7 /100 | #231 | Tragic 14.8% |
| Osage | 1.5 /100 | #232 | Tragic 14.8% |
| Immigrants | Saudi Arabia | 1.4 /100 | #233 | Tragic 14.8% |
Demographics Similar to Immigrants from Dominican Republic by Female Poverty
In terms of female poverty, the demographic groups most similar to Immigrants from Dominican Republic are Apache (19.2%, a difference of 0.60%), Native/Alaskan (19.2%, a difference of 0.76%), Dominican (19.1%, a difference of 1.2%), Houma (20.0%, a difference of 3.6%), and Kiowa (18.6%, a difference of 3.9%).
| Demographics | Rating | Rank | Female Poverty |
| Central American Indians | 0.0 /100 | #326 | Tragic 18.0% |
| Yakama | 0.0 /100 | #327 | Tragic 18.0% |
| Blacks/African Americans | 0.0 /100 | #328 | Tragic 18.6% |
| Kiowa | 0.0 /100 | #329 | Tragic 18.6% |
| Dominicans | 0.0 /100 | #330 | Tragic 19.1% |
| Natives/Alaskans | 0.0 /100 | #331 | Tragic 19.2% |
| Apache | 0.0 /100 | #332 | Tragic 19.2% |
| Immigrants | Dominican Republic | 0.0 /100 | #333 | Tragic 19.3% |
| Houma | 0.0 /100 | #334 | Tragic 20.0% |
| Cheyenne | 0.0 /100 | #335 | Tragic 20.2% |
| Pueblo | 0.0 /100 | #336 | Tragic 20.7% |
| Yuman | 0.0 /100 | #337 | Tragic 20.8% |
| Sioux | 0.0 /100 | #338 | Tragic 20.9% |
| Hopi | 0.0 /100 | #339 | Tragic 21.0% |
| Yup'ik | 0.0 /100 | #340 | Tragic 21.5% |