Bermudan vs Immigrants from Dominican Republic Female Poverty
COMPARE
Bermudan
Immigrants from Dominican Republic
Female Poverty
Female Poverty Comparison
Bermudans
Immigrants from Dominican Republic
14.4%
FEMALE POVERTY
5.5/ 100
METRIC RATING
212th/ 347
METRIC RANK
19.3%
FEMALE POVERTY
0.0/ 100
METRIC RATING
333rd/ 347
METRIC RANK
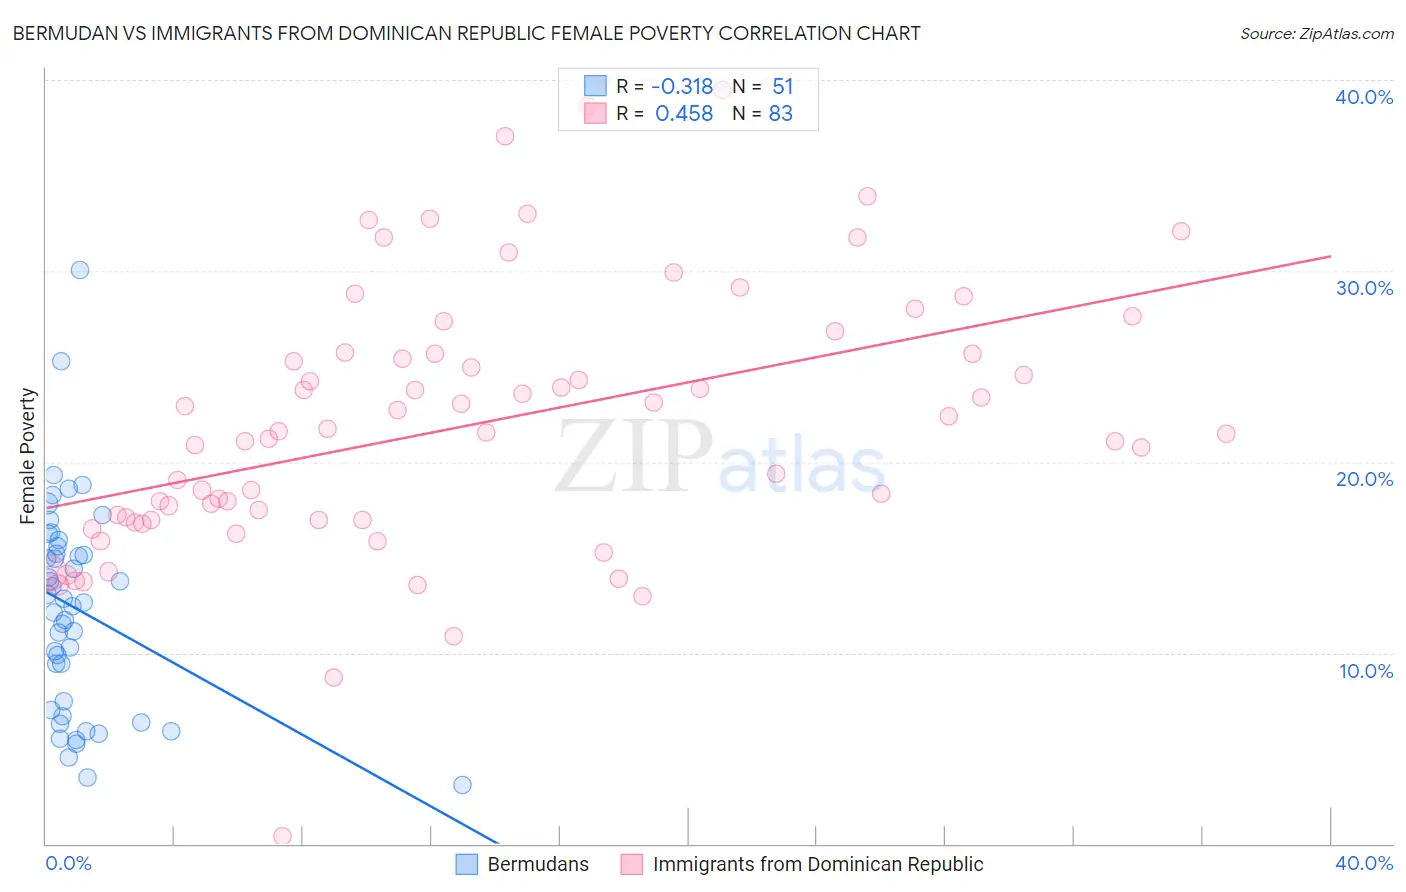
Bermudan vs Immigrants from Dominican Republic Female Poverty Correlation Chart
The statistical analysis conducted on geographies consisting of 55,716,155 people shows a mild negative correlation between the proportion of Bermudans and poverty level among females in the United States with a correlation coefficient (R) of -0.318 and weighted average of 14.4%. Similarly, the statistical analysis conducted on geographies consisting of 274,906,284 people shows a moderate positive correlation between the proportion of Immigrants from Dominican Republic and poverty level among females in the United States with a correlation coefficient (R) of 0.458 and weighted average of 19.3%, a difference of 34.7%.
Female Poverty Correlation Summary
| Measurement | Bermudan | Immigrants from Dominican Republic |
| Minimum | 3.1% | 0.39% |
| Maximum | 30.0% | 39.5% |
| Range | 26.9% | 39.1% |
| Mean | 12.3% | 21.9% |
| Median | 12.6% | 21.5% |
| Interquartile 25% (IQ1) | 7.0% | 17.0% |
| Interquartile 75% (IQ3) | 15.6% | 25.7% |
| Interquartile Range (IQR) | 8.5% | 8.7% |
| Standard Deviation (Sample) | 5.5% | 7.0% |
| Standard Deviation (Population) | 5.5% | 7.0% |
Similar Demographics by Female Poverty
Demographics Similar to Bermudans by Female Poverty
In terms of female poverty, the demographic groups most similar to Bermudans are Alaskan Athabascan (14.4%, a difference of 0.080%), Marshallese (14.4%, a difference of 0.24%), Immigrants from Panama (14.4%, a difference of 0.39%), Immigrants from Thailand (14.4%, a difference of 0.47%), and Immigrants (14.4%, a difference of 0.51%).
| Demographics | Rating | Rank | Female Poverty |
| Ugandans | 15.4 /100 | #205 | Poor 14.0% |
| Immigrants | Uruguay | 14.0 /100 | #206 | Poor 14.0% |
| Immigrants | Eastern Africa | 9.0 /100 | #207 | Tragic 14.2% |
| Immigrants | Azores | 7.9 /100 | #208 | Tragic 14.2% |
| Panamanians | 7.7 /100 | #209 | Tragic 14.2% |
| Malaysians | 7.4 /100 | #210 | Tragic 14.3% |
| Moroccans | 7.2 /100 | #211 | Tragic 14.3% |
| Bermudans | 5.5 /100 | #212 | Tragic 14.4% |
| Alaskan Athabascans | 5.3 /100 | #213 | Tragic 14.4% |
| Marshallese | 5.0 /100 | #214 | Tragic 14.4% |
| Immigrants | Panama | 4.7 /100 | #215 | Tragic 14.4% |
| Immigrants | Thailand | 4.5 /100 | #216 | Tragic 14.4% |
| Immigrants | Immigrants | 4.5 /100 | #217 | Tragic 14.4% |
| Immigrants | Uzbekistan | 4.4 /100 | #218 | Tragic 14.4% |
| Japanese | 4.1 /100 | #219 | Tragic 14.5% |
Demographics Similar to Immigrants from Dominican Republic by Female Poverty
In terms of female poverty, the demographic groups most similar to Immigrants from Dominican Republic are Apache (19.2%, a difference of 0.60%), Native/Alaskan (19.2%, a difference of 0.76%), Dominican (19.1%, a difference of 1.2%), Houma (20.0%, a difference of 3.6%), and Kiowa (18.6%, a difference of 3.9%).
| Demographics | Rating | Rank | Female Poverty |
| Central American Indians | 0.0 /100 | #326 | Tragic 18.0% |
| Yakama | 0.0 /100 | #327 | Tragic 18.0% |
| Blacks/African Americans | 0.0 /100 | #328 | Tragic 18.6% |
| Kiowa | 0.0 /100 | #329 | Tragic 18.6% |
| Dominicans | 0.0 /100 | #330 | Tragic 19.1% |
| Natives/Alaskans | 0.0 /100 | #331 | Tragic 19.2% |
| Apache | 0.0 /100 | #332 | Tragic 19.2% |
| Immigrants | Dominican Republic | 0.0 /100 | #333 | Tragic 19.3% |
| Houma | 0.0 /100 | #334 | Tragic 20.0% |
| Cheyenne | 0.0 /100 | #335 | Tragic 20.2% |
| Pueblo | 0.0 /100 | #336 | Tragic 20.7% |
| Yuman | 0.0 /100 | #337 | Tragic 20.8% |
| Sioux | 0.0 /100 | #338 | Tragic 20.9% |
| Hopi | 0.0 /100 | #339 | Tragic 21.0% |
| Yup'ik | 0.0 /100 | #340 | Tragic 21.5% |