Cajun vs Portuguese Single Female Poverty
COMPARE
Cajun
Portuguese
Single Female Poverty
Single Female Poverty Comparison
Cajuns
Portuguese
30.6%
SINGLE FEMALE POVERTY
0.0/ 100
METRIC RATING
340th/ 347
METRIC RANK
20.5%
SINGLE FEMALE POVERTY
81.5/ 100
METRIC RATING
149th/ 347
METRIC RANK
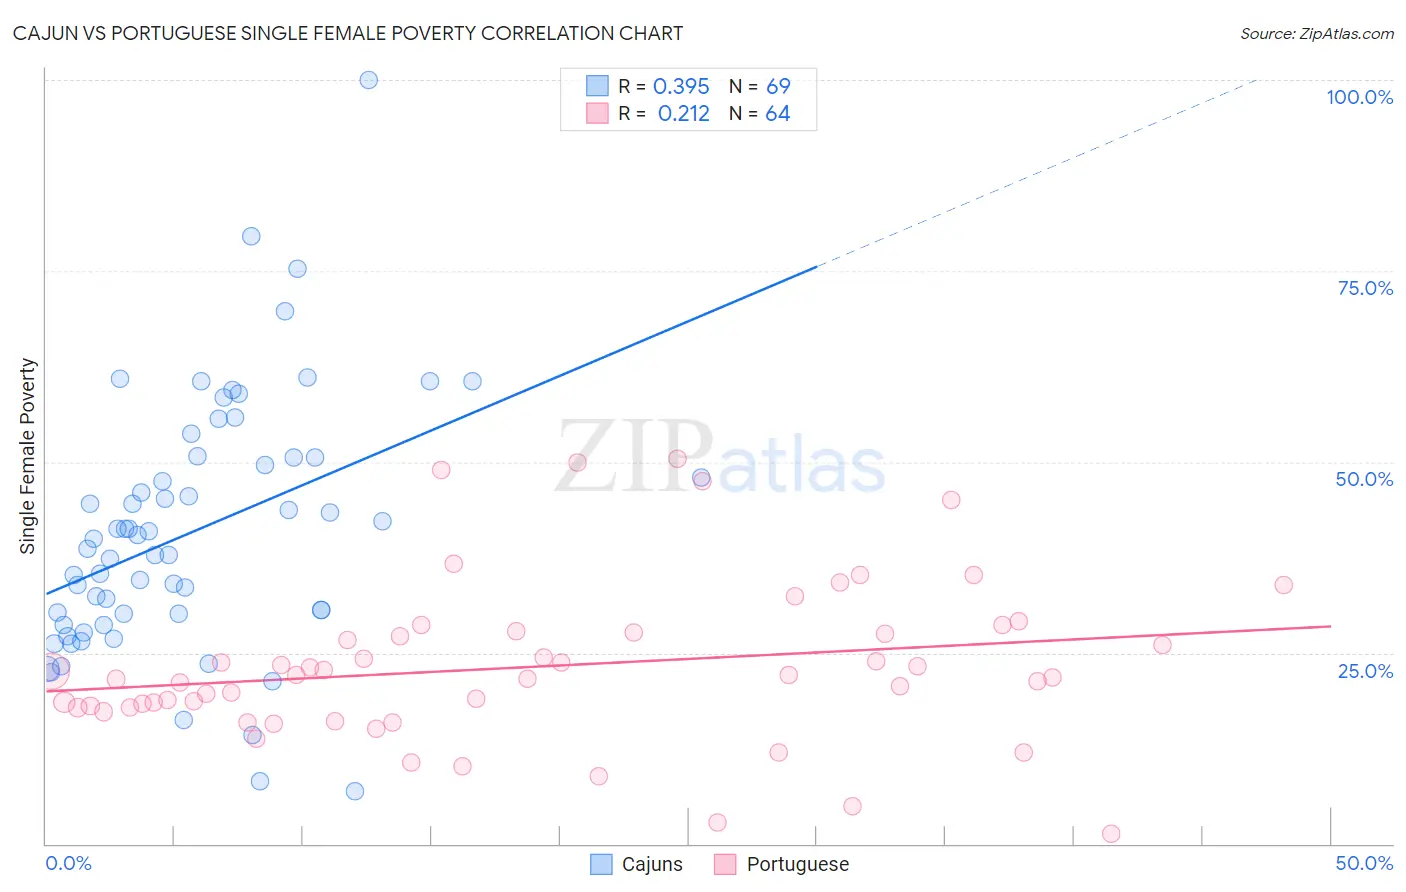
Cajun vs Portuguese Single Female Poverty Correlation Chart
The statistical analysis conducted on geographies consisting of 148,582,163 people shows a mild positive correlation between the proportion of Cajuns and poverty level among single females in the United States with a correlation coefficient (R) of 0.395 and weighted average of 30.6%. Similarly, the statistical analysis conducted on geographies consisting of 440,230,754 people shows a weak positive correlation between the proportion of Portuguese and poverty level among single females in the United States with a correlation coefficient (R) of 0.212 and weighted average of 20.5%, a difference of 49.3%.
Single Female Poverty Correlation Summary
| Measurement | Cajun | Portuguese |
| Minimum | 6.8% | 1.2% |
| Maximum | 100.0% | 50.5% |
| Range | 93.2% | 49.2% |
| Mean | 40.8% | 23.2% |
| Median | 39.9% | 22.0% |
| Interquartile 25% (IQ1) | 29.3% | 17.8% |
| Interquartile 75% (IQ3) | 50.5% | 27.5% |
| Interquartile Range (IQR) | 21.2% | 9.7% |
| Standard Deviation (Sample) | 16.6% | 10.4% |
| Standard Deviation (Population) | 16.5% | 10.3% |
Similar Demographics by Single Female Poverty
Demographics Similar to Cajuns by Single Female Poverty
In terms of single female poverty, the demographic groups most similar to Cajuns are Cheyenne (30.4%, a difference of 0.81%), Pima (30.3%, a difference of 1.0%), Sioux (31.3%, a difference of 2.0%), Navajo (31.7%, a difference of 3.3%), and Yuman (29.4%, a difference of 4.1%).
| Demographics | Rating | Rank | Single Female Poverty |
| Ute | 0.0 /100 | #333 | Tragic 28.4% |
| Pueblo | 0.0 /100 | #334 | Tragic 28.6% |
| Immigrants | Yemen | 0.0 /100 | #335 | Tragic 28.9% |
| Colville | 0.0 /100 | #336 | Tragic 29.1% |
| Yuman | 0.0 /100 | #337 | Tragic 29.4% |
| Pima | 0.0 /100 | #338 | Tragic 30.3% |
| Cheyenne | 0.0 /100 | #339 | Tragic 30.4% |
| Cajuns | 0.0 /100 | #340 | Tragic 30.6% |
| Sioux | 0.0 /100 | #341 | Tragic 31.3% |
| Navajo | 0.0 /100 | #342 | Tragic 31.7% |
| Crow | 0.0 /100 | #343 | Tragic 32.4% |
| Lumbee | 0.0 /100 | #344 | Tragic 33.0% |
| Houma | 0.0 /100 | #345 | Tragic 33.8% |
| Puerto Ricans | 0.0 /100 | #346 | Tragic 34.1% |
| Tohono O'odham | 0.0 /100 | #347 | Tragic 34.2% |
Demographics Similar to Portuguese by Single Female Poverty
In terms of single female poverty, the demographic groups most similar to Portuguese are Immigrants from Denmark (20.5%, a difference of 0.10%), Puget Sound Salish (20.6%, a difference of 0.19%), Immigrants from Uruguay (20.6%, a difference of 0.38%), Luxembourger (20.4%, a difference of 0.39%), and Swedish (20.6%, a difference of 0.43%).
| Demographics | Rating | Rank | Single Female Poverty |
| Immigrants | Uganda | 89.1 /100 | #142 | Excellent 20.3% |
| Australians | 88.4 /100 | #143 | Excellent 20.3% |
| Immigrants | Uzbekistan | 88.3 /100 | #144 | Excellent 20.3% |
| Austrians | 85.8 /100 | #145 | Excellent 20.4% |
| Venezuelans | 85.5 /100 | #146 | Excellent 20.4% |
| South Africans | 85.3 /100 | #147 | Excellent 20.4% |
| Luxembourgers | 84.9 /100 | #148 | Excellent 20.4% |
| Portuguese | 81.5 /100 | #149 | Excellent 20.5% |
| Immigrants | Denmark | 80.5 /100 | #150 | Excellent 20.5% |
| Puget Sound Salish | 79.6 /100 | #151 | Good 20.6% |
| Immigrants | Uruguay | 77.7 /100 | #152 | Good 20.6% |
| Swedes | 77.1 /100 | #153 | Good 20.6% |
| Immigrants | Western Europe | 76.7 /100 | #154 | Good 20.6% |
| Samoans | 76.0 /100 | #155 | Good 20.6% |
| South American Indians | 75.7 /100 | #156 | Good 20.6% |