Assyrian/Chaldean/Syriac vs Immigrants from West Indies Single Female Poverty
COMPARE
Assyrian/Chaldean/Syriac
Immigrants from West Indies
Single Female Poverty
Single Female Poverty Comparison
Assyrians/Chaldeans/Syriacs
Immigrants from West Indies
17.0%
SINGLE FEMALE POVERTY
100.0/ 100
METRIC RATING
5th/ 347
METRIC RANK
22.5%
SINGLE FEMALE POVERTY
1.0/ 100
METRIC RATING
251st/ 347
METRIC RANK
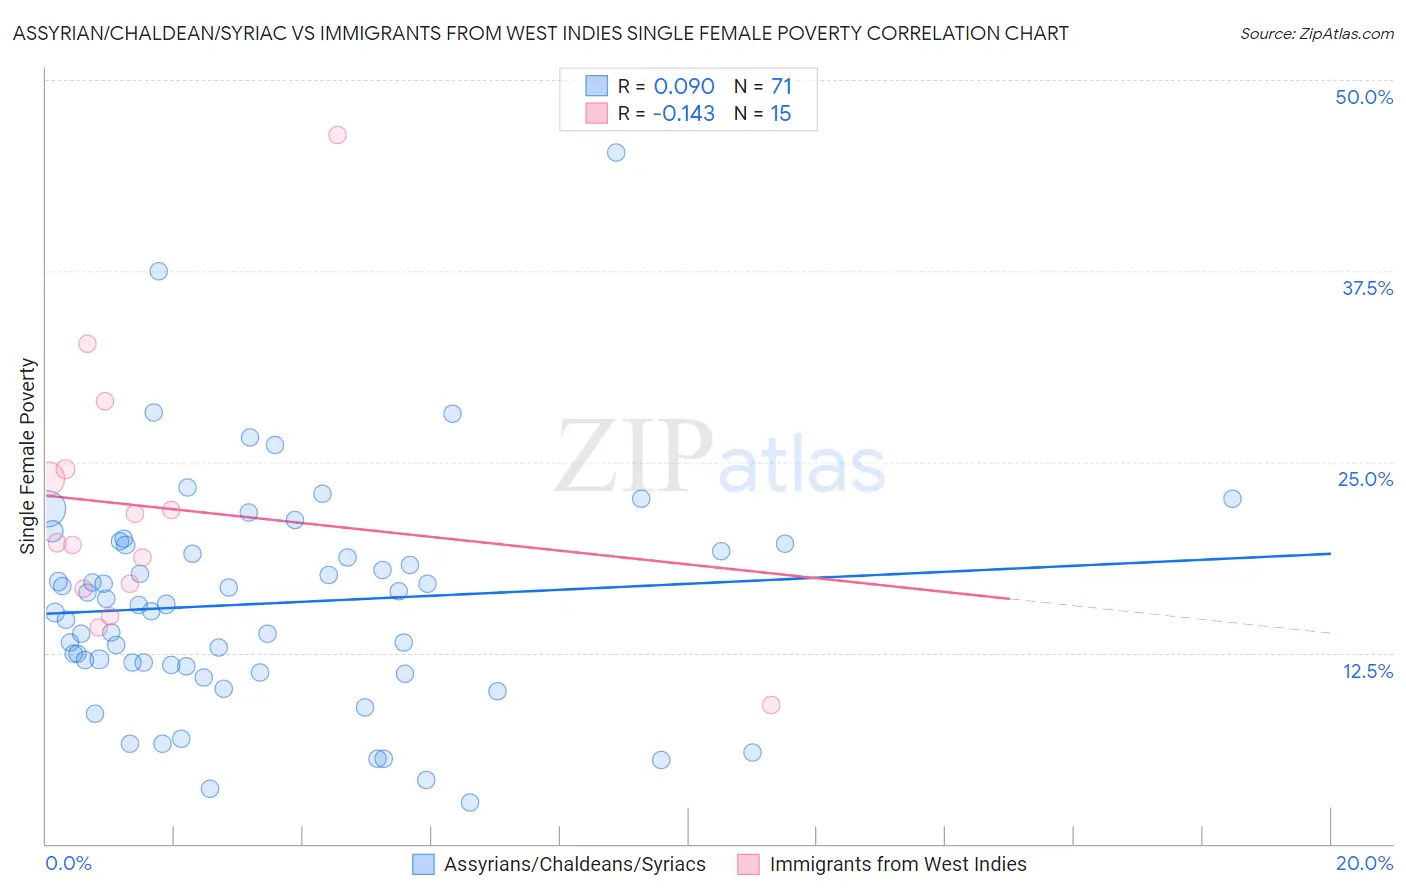
Assyrian/Chaldean/Syriac vs Immigrants from West Indies Single Female Poverty Correlation Chart
The statistical analysis conducted on geographies consisting of 109,756,092 people shows a slight positive correlation between the proportion of Assyrians/Chaldeans/Syriacs and poverty level among single females in the United States with a correlation coefficient (R) of 0.090 and weighted average of 17.0%. Similarly, the statistical analysis conducted on geographies consisting of 72,360,150 people shows a poor negative correlation between the proportion of Immigrants from West Indies and poverty level among single females in the United States with a correlation coefficient (R) of -0.143 and weighted average of 22.5%, a difference of 32.7%.
Single Female Poverty Correlation Summary
| Measurement | Assyrian/Chaldean/Syriac | Immigrants from West Indies |
| Minimum | 2.7% | 9.1% |
| Maximum | 45.3% | 46.4% |
| Range | 42.5% | 37.3% |
| Mean | 15.7% | 22.0% |
| Median | 15.6% | 19.7% |
| Interquartile 25% (IQ1) | 11.7% | 16.7% |
| Interquartile 75% (IQ3) | 19.6% | 24.5% |
| Interquartile Range (IQR) | 7.9% | 7.8% |
| Standard Deviation (Sample) | 7.4% | 9.0% |
| Standard Deviation (Population) | 7.3% | 8.7% |
Similar Demographics by Single Female Poverty
Demographics Similar to Assyrians/Chaldeans/Syriacs by Single Female Poverty
In terms of single female poverty, the demographic groups most similar to Assyrians/Chaldeans/Syriacs are Filipino (17.0%, a difference of 0.20%), Immigrants from India (16.8%, a difference of 0.83%), Thai (17.3%, a difference of 1.9%), Immigrants from Hong Kong (16.5%, a difference of 2.6%), and Immigrants from Iran (17.5%, a difference of 3.0%).
| Demographics | Rating | Rank | Single Female Poverty |
| Chinese | 100.0 /100 | #1 | Exceptional 16.1% |
| Immigrants | Taiwan | 100.0 /100 | #2 | Exceptional 16.4% |
| Immigrants | Hong Kong | 100.0 /100 | #3 | Exceptional 16.5% |
| Immigrants | India | 100.0 /100 | #4 | Exceptional 16.8% |
| Assyrians/Chaldeans/Syriacs | 100.0 /100 | #5 | Exceptional 17.0% |
| Filipinos | 100.0 /100 | #6 | Exceptional 17.0% |
| Thais | 100.0 /100 | #7 | Exceptional 17.3% |
| Immigrants | Iran | 100.0 /100 | #8 | Exceptional 17.5% |
| Bhutanese | 100.0 /100 | #9 | Exceptional 17.7% |
| Immigrants | Ireland | 100.0 /100 | #10 | Exceptional 17.8% |
| Immigrants | Lithuania | 100.0 /100 | #11 | Exceptional 17.8% |
| Immigrants | South Central Asia | 100.0 /100 | #12 | Exceptional 17.8% |
| Immigrants | Bolivia | 100.0 /100 | #13 | Exceptional 17.8% |
| Bolivians | 100.0 /100 | #14 | Exceptional 17.9% |
| Indians (Asian) | 100.0 /100 | #15 | Exceptional 17.9% |
Demographics Similar to Immigrants from West Indies by Single Female Poverty
In terms of single female poverty, the demographic groups most similar to Immigrants from West Indies are Delaware (22.5%, a difference of 0.11%), Immigrants from Bahamas (22.5%, a difference of 0.14%), Immigrants from Liberia (22.5%, a difference of 0.20%), Immigrants from Caribbean (22.4%, a difference of 0.29%), and Immigrants from Burma/Myanmar (22.6%, a difference of 0.30%).
| Demographics | Rating | Rank | Single Female Poverty |
| Immigrants | Middle Africa | 1.9 /100 | #244 | Tragic 22.3% |
| Immigrants | Bangladesh | 1.8 /100 | #245 | Tragic 22.3% |
| Liberians | 1.4 /100 | #246 | Tragic 22.4% |
| Immigrants | El Salvador | 1.4 /100 | #247 | Tragic 22.4% |
| Belizeans | 1.4 /100 | #248 | Tragic 22.4% |
| Immigrants | Caribbean | 1.3 /100 | #249 | Tragic 22.4% |
| Immigrants | Bahamas | 1.2 /100 | #250 | Tragic 22.5% |
| Immigrants | West Indies | 1.0 /100 | #251 | Tragic 22.5% |
| Delaware | 1.0 /100 | #252 | Tragic 22.5% |
| Immigrants | Liberia | 0.9 /100 | #253 | Tragic 22.5% |
| Immigrants | Burma/Myanmar | 0.8 /100 | #254 | Tragic 22.6% |
| Immigrants | Sudan | 0.8 /100 | #255 | Tragic 22.6% |
| Immigrants | Belize | 0.8 /100 | #256 | Tragic 22.6% |
| Sudanese | 0.7 /100 | #257 | Tragic 22.6% |
| Bahamians | 0.6 /100 | #258 | Tragic 22.7% |