Syrian vs Immigrants from West Indies Single Female Poverty
COMPARE
Syrian
Immigrants from West Indies
Single Female Poverty
Single Female Poverty Comparison
Syrians
Immigrants from West Indies
20.3%
SINGLE FEMALE POVERTY
90.4/ 100
METRIC RATING
140th/ 347
METRIC RANK
22.5%
SINGLE FEMALE POVERTY
1.0/ 100
METRIC RATING
251st/ 347
METRIC RANK
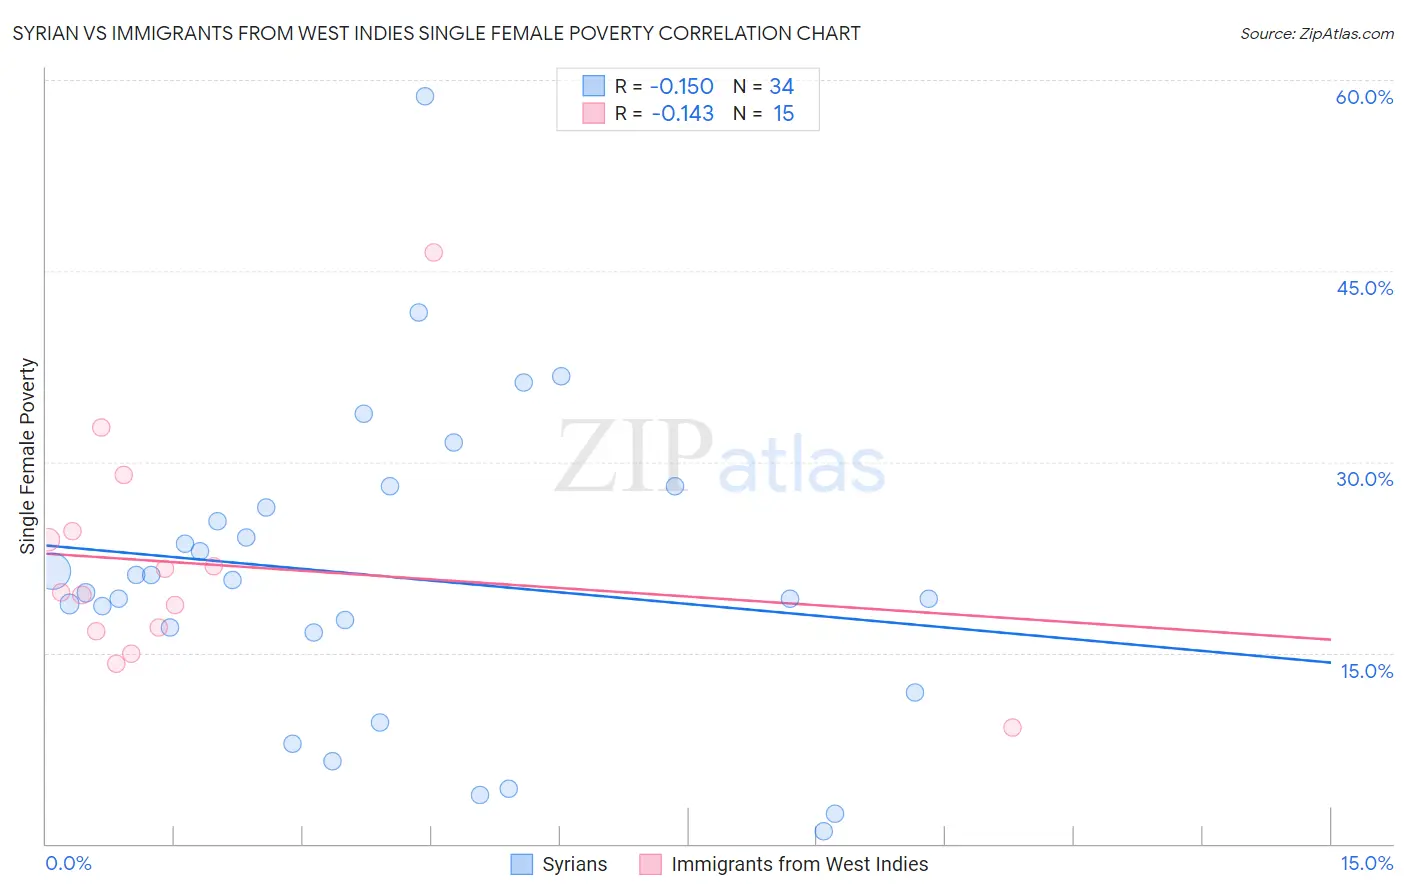
Syrian vs Immigrants from West Indies Single Female Poverty Correlation Chart
The statistical analysis conducted on geographies consisting of 263,006,420 people shows a poor negative correlation between the proportion of Syrians and poverty level among single females in the United States with a correlation coefficient (R) of -0.150 and weighted average of 20.3%. Similarly, the statistical analysis conducted on geographies consisting of 72,360,150 people shows a poor negative correlation between the proportion of Immigrants from West Indies and poverty level among single females in the United States with a correlation coefficient (R) of -0.143 and weighted average of 22.5%, a difference of 11.0%.
Single Female Poverty Correlation Summary
| Measurement | Syrian | Immigrants from West Indies |
| Minimum | 0.97% | 9.1% |
| Maximum | 58.7% | 46.4% |
| Range | 57.7% | 37.3% |
| Mean | 21.0% | 22.0% |
| Median | 20.2% | 19.7% |
| Interquartile 25% (IQ1) | 16.6% | 16.7% |
| Interquartile 75% (IQ3) | 26.4% | 24.5% |
| Interquartile Range (IQR) | 9.8% | 7.8% |
| Standard Deviation (Sample) | 12.0% | 9.0% |
| Standard Deviation (Population) | 11.8% | 8.7% |
Similar Demographics by Single Female Poverty
Demographics Similar to Syrians by Single Female Poverty
In terms of single female poverty, the demographic groups most similar to Syrians are Slovene (20.3%, a difference of 0.010%), Immigrants from Kuwait (20.3%, a difference of 0.010%), Immigrants from Nepal (20.3%, a difference of 0.050%), Immigrants from North America (20.3%, a difference of 0.15%), and Immigrants from Iraq (20.2%, a difference of 0.16%).
| Demographics | Rating | Rank | Single Female Poverty |
| Immigrants | England | 91.9 /100 | #133 | Exceptional 20.2% |
| Immigrants | Venezuela | 91.5 /100 | #134 | Exceptional 20.2% |
| Immigrants | Iraq | 91.2 /100 | #135 | Exceptional 20.2% |
| Immigrants | Canada | 91.2 /100 | #136 | Exceptional 20.2% |
| Immigrants | Nepal | 90.6 /100 | #137 | Exceptional 20.3% |
| Slovenes | 90.5 /100 | #138 | Exceptional 20.3% |
| Immigrants | Kuwait | 90.4 /100 | #139 | Exceptional 20.3% |
| Syrians | 90.4 /100 | #140 | Exceptional 20.3% |
| Immigrants | North America | 89.5 /100 | #141 | Excellent 20.3% |
| Immigrants | Uganda | 89.1 /100 | #142 | Excellent 20.3% |
| Australians | 88.4 /100 | #143 | Excellent 20.3% |
| Immigrants | Uzbekistan | 88.3 /100 | #144 | Excellent 20.3% |
| Austrians | 85.8 /100 | #145 | Excellent 20.4% |
| Venezuelans | 85.5 /100 | #146 | Excellent 20.4% |
| South Africans | 85.3 /100 | #147 | Excellent 20.4% |
Demographics Similar to Immigrants from West Indies by Single Female Poverty
In terms of single female poverty, the demographic groups most similar to Immigrants from West Indies are Delaware (22.5%, a difference of 0.11%), Immigrants from Bahamas (22.5%, a difference of 0.14%), Immigrants from Liberia (22.5%, a difference of 0.20%), Immigrants from Caribbean (22.4%, a difference of 0.29%), and Immigrants from Burma/Myanmar (22.6%, a difference of 0.30%).
| Demographics | Rating | Rank | Single Female Poverty |
| Immigrants | Middle Africa | 1.9 /100 | #244 | Tragic 22.3% |
| Immigrants | Bangladesh | 1.8 /100 | #245 | Tragic 22.3% |
| Liberians | 1.4 /100 | #246 | Tragic 22.4% |
| Immigrants | El Salvador | 1.4 /100 | #247 | Tragic 22.4% |
| Belizeans | 1.4 /100 | #248 | Tragic 22.4% |
| Immigrants | Caribbean | 1.3 /100 | #249 | Tragic 22.4% |
| Immigrants | Bahamas | 1.2 /100 | #250 | Tragic 22.5% |
| Immigrants | West Indies | 1.0 /100 | #251 | Tragic 22.5% |
| Delaware | 1.0 /100 | #252 | Tragic 22.5% |
| Immigrants | Liberia | 0.9 /100 | #253 | Tragic 22.5% |
| Immigrants | Burma/Myanmar | 0.8 /100 | #254 | Tragic 22.6% |
| Immigrants | Sudan | 0.8 /100 | #255 | Tragic 22.6% |
| Immigrants | Belize | 0.8 /100 | #256 | Tragic 22.6% |
| Sudanese | 0.7 /100 | #257 | Tragic 22.6% |
| Bahamians | 0.6 /100 | #258 | Tragic 22.7% |