Immigrants from Vietnam vs Immigrants from West Indies Single Female Poverty
COMPARE
Immigrants from Vietnam
Immigrants from West Indies
Single Female Poverty
Single Female Poverty Comparison
Immigrants from Vietnam
Immigrants from West Indies
19.1%
SINGLE FEMALE POVERTY
99.7/ 100
METRIC RATING
55th/ 347
METRIC RANK
22.5%
SINGLE FEMALE POVERTY
1.0/ 100
METRIC RATING
251st/ 347
METRIC RANK
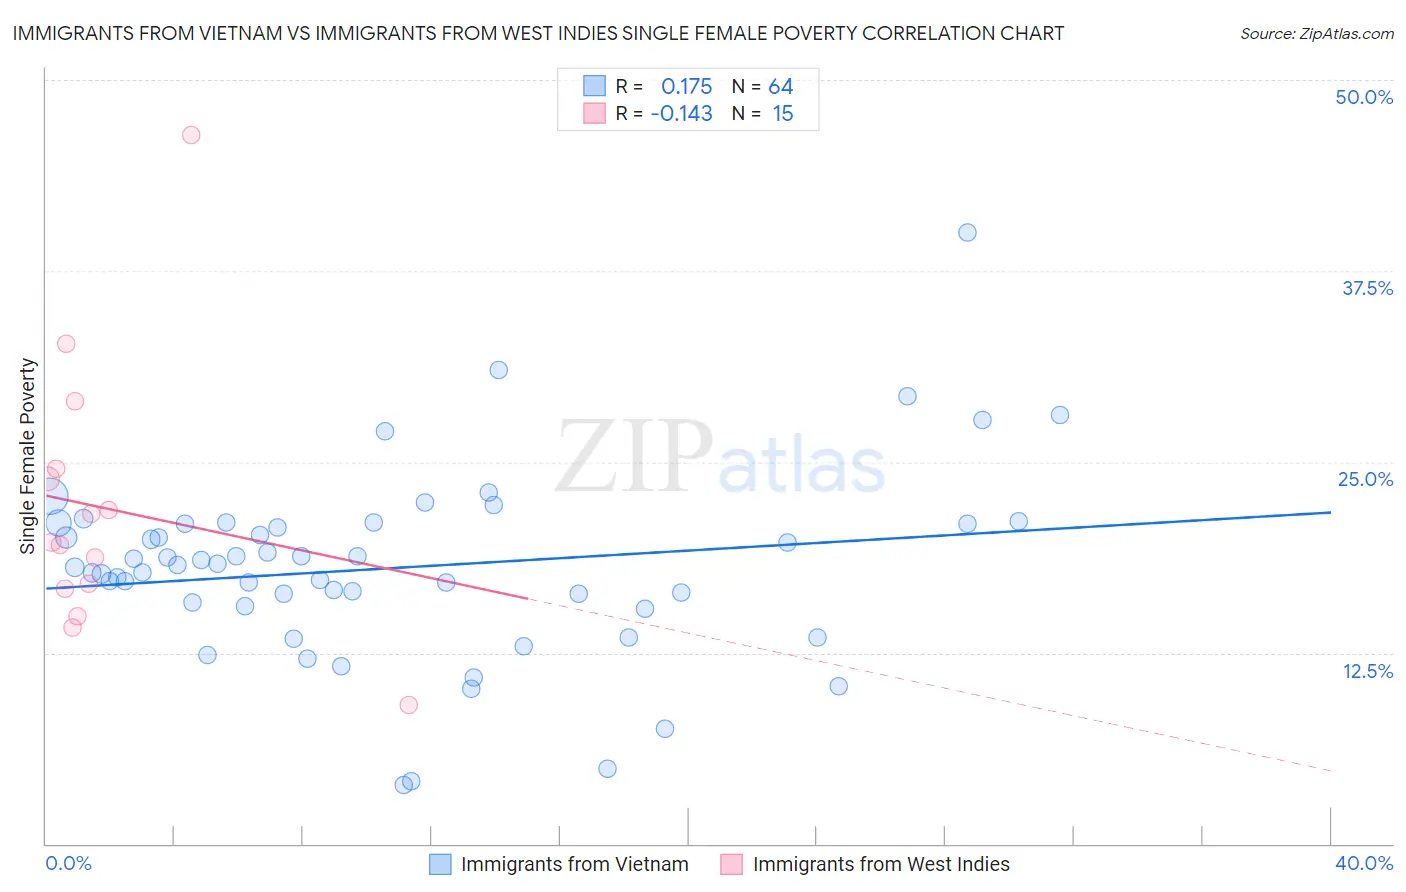
Immigrants from Vietnam vs Immigrants from West Indies Single Female Poverty Correlation Chart
The statistical analysis conducted on geographies consisting of 399,262,621 people shows a poor positive correlation between the proportion of Immigrants from Vietnam and poverty level among single females in the United States with a correlation coefficient (R) of 0.175 and weighted average of 19.1%. Similarly, the statistical analysis conducted on geographies consisting of 72,360,150 people shows a poor negative correlation between the proportion of Immigrants from West Indies and poverty level among single females in the United States with a correlation coefficient (R) of -0.143 and weighted average of 22.5%, a difference of 17.7%.
Single Female Poverty Correlation Summary
| Measurement | Immigrants from Vietnam | Immigrants from West Indies |
| Minimum | 3.8% | 9.1% |
| Maximum | 40.0% | 46.4% |
| Range | 36.2% | 37.3% |
| Mean | 18.0% | 22.0% |
| Median | 18.2% | 19.7% |
| Interquartile 25% (IQ1) | 15.7% | 16.7% |
| Interquartile 75% (IQ3) | 20.9% | 24.5% |
| Interquartile Range (IQR) | 5.3% | 7.8% |
| Standard Deviation (Sample) | 6.1% | 9.0% |
| Standard Deviation (Population) | 6.0% | 8.7% |
Similar Demographics by Single Female Poverty
Demographics Similar to Immigrants from Vietnam by Single Female Poverty
In terms of single female poverty, the demographic groups most similar to Immigrants from Vietnam are Argentinean (19.1%, a difference of 0.040%), Tsimshian (19.1%, a difference of 0.050%), Immigrants from Fiji (19.1%, a difference of 0.050%), Eastern European (19.1%, a difference of 0.11%), and Immigrants from Bulgaria (19.1%, a difference of 0.23%).
| Demographics | Rating | Rank | Single Female Poverty |
| Immigrants | Argentina | 99.8 /100 | #48 | Exceptional 19.0% |
| Immigrants | Czechoslovakia | 99.8 /100 | #49 | Exceptional 19.0% |
| Immigrants | Eastern Europe | 99.8 /100 | #50 | Exceptional 19.0% |
| Immigrants | Italy | 99.8 /100 | #51 | Exceptional 19.0% |
| Egyptians | 99.7 /100 | #52 | Exceptional 19.1% |
| Tsimshian | 99.7 /100 | #53 | Exceptional 19.1% |
| Argentineans | 99.7 /100 | #54 | Exceptional 19.1% |
| Immigrants | Vietnam | 99.7 /100 | #55 | Exceptional 19.1% |
| Immigrants | Fiji | 99.7 /100 | #56 | Exceptional 19.1% |
| Eastern Europeans | 99.7 /100 | #57 | Exceptional 19.1% |
| Immigrants | Bulgaria | 99.7 /100 | #58 | Exceptional 19.1% |
| Sri Lankans | 99.6 /100 | #59 | Exceptional 19.2% |
| Russians | 99.6 /100 | #60 | Exceptional 19.2% |
| Cambodians | 99.6 /100 | #61 | Exceptional 19.2% |
| Lithuanians | 99.6 /100 | #62 | Exceptional 19.2% |
Demographics Similar to Immigrants from West Indies by Single Female Poverty
In terms of single female poverty, the demographic groups most similar to Immigrants from West Indies are Delaware (22.5%, a difference of 0.11%), Immigrants from Bahamas (22.5%, a difference of 0.14%), Immigrants from Liberia (22.5%, a difference of 0.20%), Immigrants from Caribbean (22.4%, a difference of 0.29%), and Immigrants from Burma/Myanmar (22.6%, a difference of 0.30%).
| Demographics | Rating | Rank | Single Female Poverty |
| Immigrants | Middle Africa | 1.9 /100 | #244 | Tragic 22.3% |
| Immigrants | Bangladesh | 1.8 /100 | #245 | Tragic 22.3% |
| Liberians | 1.4 /100 | #246 | Tragic 22.4% |
| Immigrants | El Salvador | 1.4 /100 | #247 | Tragic 22.4% |
| Belizeans | 1.4 /100 | #248 | Tragic 22.4% |
| Immigrants | Caribbean | 1.3 /100 | #249 | Tragic 22.4% |
| Immigrants | Bahamas | 1.2 /100 | #250 | Tragic 22.5% |
| Immigrants | West Indies | 1.0 /100 | #251 | Tragic 22.5% |
| Delaware | 1.0 /100 | #252 | Tragic 22.5% |
| Immigrants | Liberia | 0.9 /100 | #253 | Tragic 22.5% |
| Immigrants | Burma/Myanmar | 0.8 /100 | #254 | Tragic 22.6% |
| Immigrants | Sudan | 0.8 /100 | #255 | Tragic 22.6% |
| Immigrants | Belize | 0.8 /100 | #256 | Tragic 22.6% |
| Sudanese | 0.7 /100 | #257 | Tragic 22.6% |
| Bahamians | 0.6 /100 | #258 | Tragic 22.7% |