Yaqui vs Mexican Single Female Poverty
COMPARE
Yaqui
Mexican
Single Female Poverty
Single Female Poverty Comparison
Yaqui
Mexicans
24.9%
SINGLE FEMALE POVERTY
0.0/ 100
METRIC RATING
298th/ 347
METRIC RANK
25.0%
SINGLE FEMALE POVERTY
0.0/ 100
METRIC RATING
299th/ 347
METRIC RANK
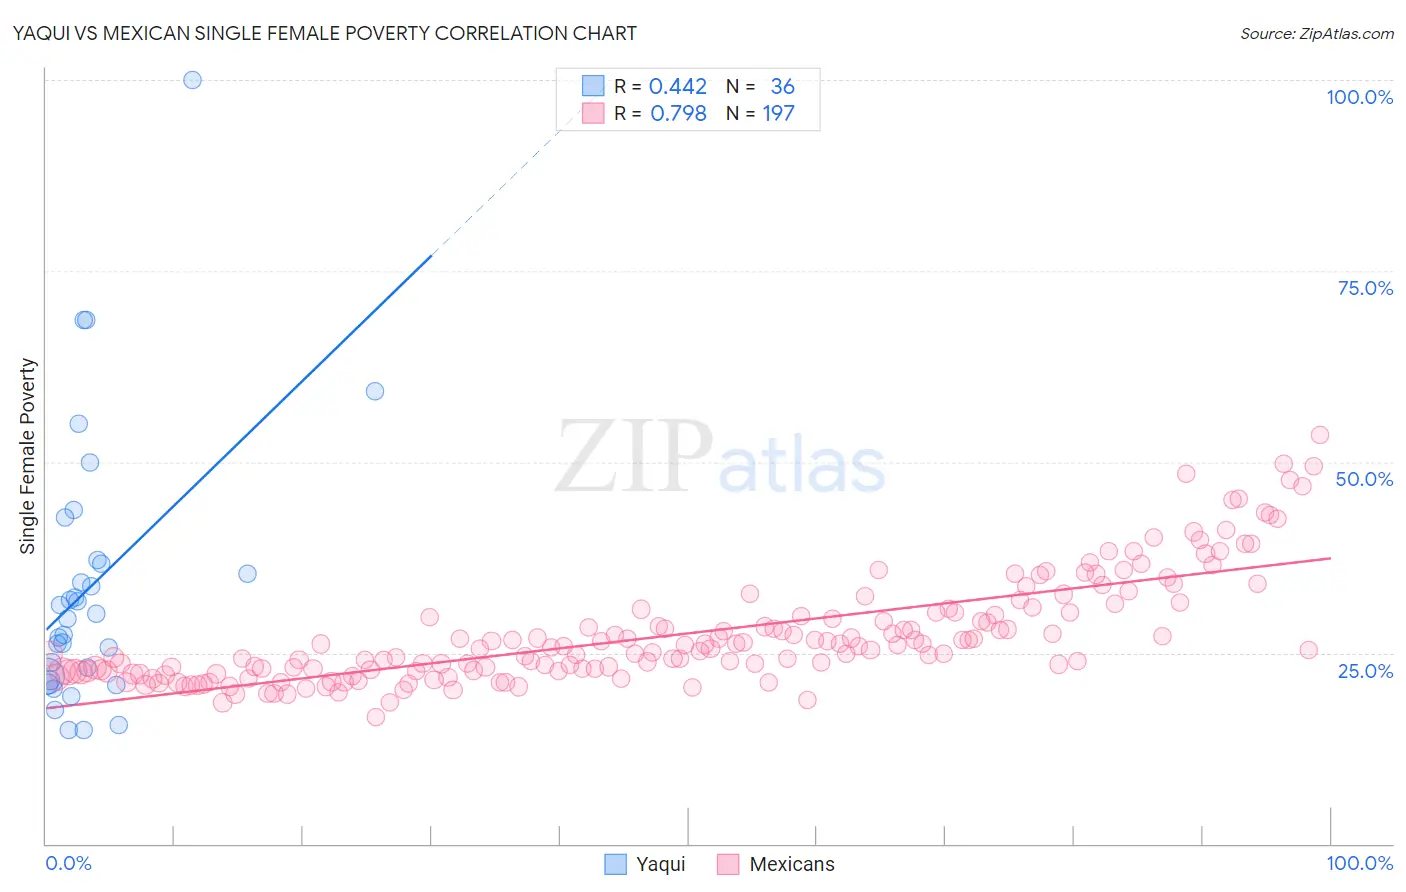
Yaqui vs Mexican Single Female Poverty Correlation Chart
The statistical analysis conducted on geographies consisting of 107,224,239 people shows a moderate positive correlation between the proportion of Yaqui and poverty level among single females in the United States with a correlation coefficient (R) of 0.442 and weighted average of 24.9%. Similarly, the statistical analysis conducted on geographies consisting of 547,731,472 people shows a strong positive correlation between the proportion of Mexicans and poverty level among single females in the United States with a correlation coefficient (R) of 0.798 and weighted average of 25.0%, a difference of 0.67%.
Single Female Poverty Correlation Summary
| Measurement | Yaqui | Mexican |
| Minimum | 14.9% | 16.6% |
| Maximum | 100.0% | 53.5% |
| Range | 85.1% | 36.9% |
| Mean | 33.8% | 27.4% |
| Median | 29.7% | 25.5% |
| Interquartile 25% (IQ1) | 21.7% | 22.6% |
| Interquartile 75% (IQ3) | 37.0% | 30.1% |
| Interquartile Range (IQR) | 15.3% | 7.5% |
| Standard Deviation (Sample) | 17.9% | 7.0% |
| Standard Deviation (Population) | 17.7% | 7.0% |
Demographics Similar to Yaqui and Mexicans by Single Female Poverty
In terms of single female poverty, the demographic groups most similar to Yaqui are Immigrants from Central America (24.8%, a difference of 0.19%), African (24.8%, a difference of 0.48%), Blackfeet (25.1%, a difference of 0.74%), Honduran (25.1%, a difference of 0.92%), and Hispanic or Latino (24.6%, a difference of 0.96%). Similarly, the demographic groups most similar to Mexicans are Blackfeet (25.1%, a difference of 0.080%), Honduran (25.1%, a difference of 0.25%), Shoshone (25.1%, a difference of 0.34%), Somali (25.2%, a difference of 0.74%), and Immigrants from Central America (24.8%, a difference of 0.86%).
| Demographics | Rating | Rank | Single Female Poverty |
| Spanish Americans | 0.0 /100 | #288 | Tragic 24.2% |
| U.S. Virgin Islanders | 0.0 /100 | #289 | Tragic 24.2% |
| Indonesians | 0.0 /100 | #290 | Tragic 24.3% |
| Osage | 0.0 /100 | #291 | Tragic 24.4% |
| Alsatians | 0.0 /100 | #292 | Tragic 24.5% |
| Americans | 0.0 /100 | #293 | Tragic 24.5% |
| French American Indians | 0.0 /100 | #294 | Tragic 24.6% |
| Hispanics or Latinos | 0.0 /100 | #295 | Tragic 24.6% |
| Africans | 0.0 /100 | #296 | Tragic 24.8% |
| Immigrants | Central America | 0.0 /100 | #297 | Tragic 24.8% |
| Yaqui | 0.0 /100 | #298 | Tragic 24.9% |
| Mexicans | 0.0 /100 | #299 | Tragic 25.0% |
| Blackfeet | 0.0 /100 | #300 | Tragic 25.1% |
| Hondurans | 0.0 /100 | #301 | Tragic 25.1% |
| Shoshone | 0.0 /100 | #302 | Tragic 25.1% |
| Somalis | 0.0 /100 | #303 | Tragic 25.2% |
| Immigrants | Congo | 0.0 /100 | #304 | Tragic 25.3% |
| Immigrants | Dominican Republic | 0.0 /100 | #305 | Tragic 25.3% |
| Immigrants | Mexico | 0.0 /100 | #306 | Tragic 25.3% |
| Potawatomi | 0.0 /100 | #307 | Tragic 25.4% |
| Aleuts | 0.0 /100 | #308 | Tragic 25.4% |