Chippewa vs Mexican Divorced or Separated
COMPARE
Chippewa
Mexican
Divorced or Separated
Divorced or Separated Comparison
Chippewa
Mexicans
13.2%
DIVORCED OR SEPARATED
0.0/ 100
METRIC RATING
305th/ 347
METRIC RANK
12.2%
DIVORCED OR SEPARATED
21.0/ 100
METRIC RATING
207th/ 347
METRIC RANK
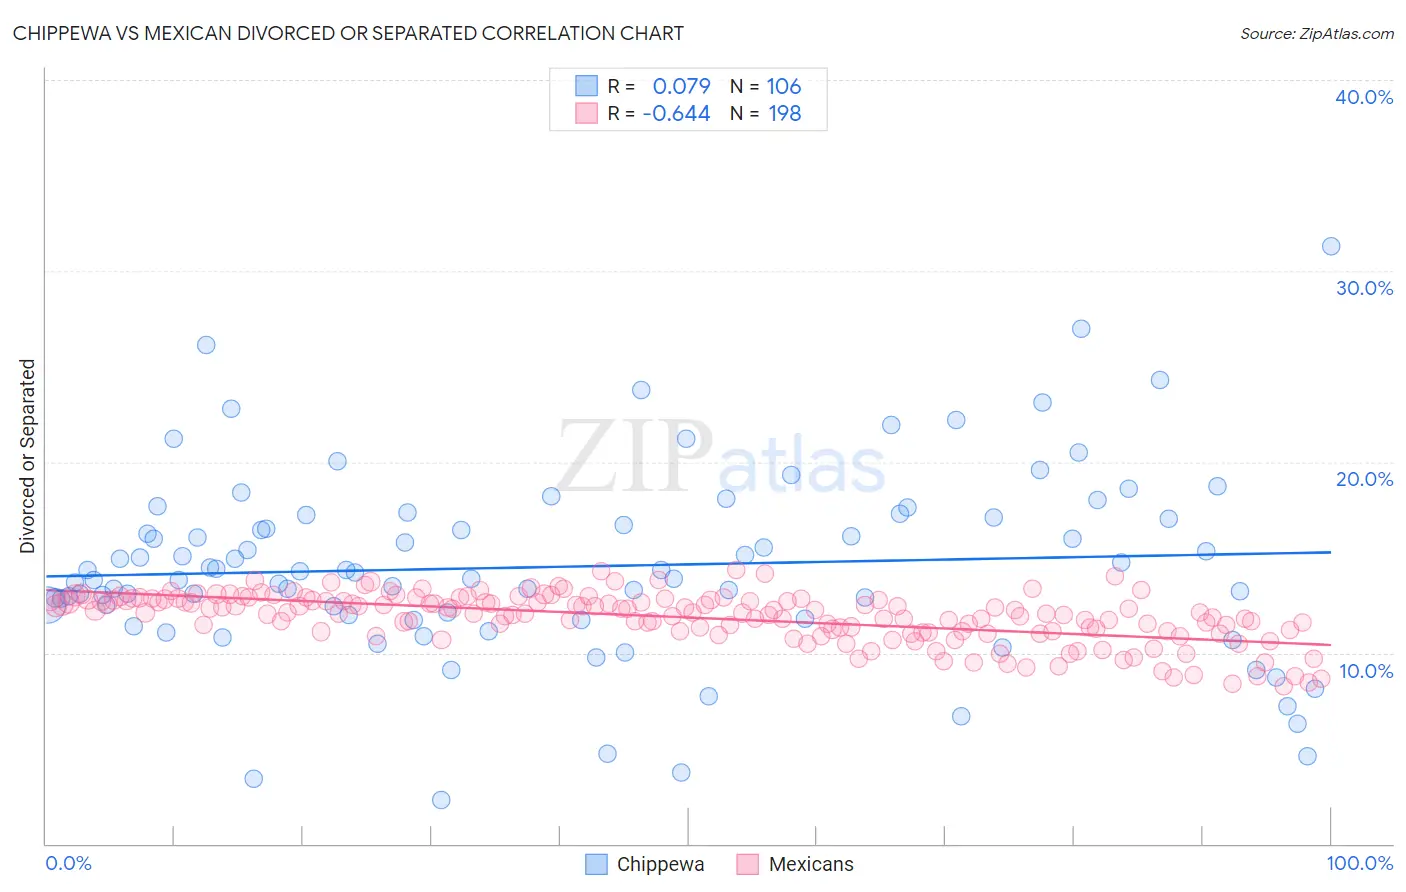
Chippewa vs Mexican Divorced or Separated Correlation Chart
The statistical analysis conducted on geographies consisting of 215,036,643 people shows a slight positive correlation between the proportion of Chippewa and percentage of population currently divorced or separated in the United States with a correlation coefficient (R) of 0.079 and weighted average of 13.2%. Similarly, the statistical analysis conducted on geographies consisting of 564,740,181 people shows a significant negative correlation between the proportion of Mexicans and percentage of population currently divorced or separated in the United States with a correlation coefficient (R) of -0.644 and weighted average of 12.2%, a difference of 8.0%.
Divorced or Separated Correlation Summary
| Measurement | Chippewa | Mexican |
| Minimum | 2.3% | 8.3% |
| Maximum | 31.3% | 14.3% |
| Range | 29.0% | 6.1% |
| Mean | 14.5% | 11.9% |
| Median | 14.2% | 12.1% |
| Interquartile 25% (IQ1) | 12.0% | 11.1% |
| Interquartile 75% (IQ3) | 17.1% | 12.8% |
| Interquartile Range (IQR) | 5.1% | 1.6% |
| Standard Deviation (Sample) | 4.9% | 1.3% |
| Standard Deviation (Population) | 4.9% | 1.3% |
Similar Demographics by Divorced or Separated
Demographics Similar to Chippewa by Divorced or Separated
In terms of divorced or separated, the demographic groups most similar to Chippewa are Hopi (13.2%, a difference of 0.050%), Tlingit-Haida (13.2%, a difference of 0.16%), Cape Verdean (13.1%, a difference of 0.18%), Immigrants from Venezuela (13.1%, a difference of 0.20%), and Alaskan Athabascan (13.1%, a difference of 0.30%).
| Demographics | Rating | Rank | Divorced or Separated |
| Venezuelans | 0.0 /100 | #298 | Tragic 13.0% |
| Immigrants | Jamaica | 0.0 /100 | #299 | Tragic 13.0% |
| Immigrants | Cabo Verde | 0.0 /100 | #300 | Tragic 13.1% |
| Alaskan Athabascans | 0.0 /100 | #301 | Tragic 13.1% |
| Immigrants | Venezuela | 0.0 /100 | #302 | Tragic 13.1% |
| Cape Verdeans | 0.0 /100 | #303 | Tragic 13.1% |
| Hopi | 0.0 /100 | #304 | Tragic 13.2% |
| Chippewa | 0.0 /100 | #305 | Tragic 13.2% |
| Tlingit-Haida | 0.0 /100 | #306 | Tragic 13.2% |
| French American Indians | 0.0 /100 | #307 | Tragic 13.2% |
| Ottawa | 0.0 /100 | #308 | Tragic 13.2% |
| Americans | 0.0 /100 | #309 | Tragic 13.2% |
| Africans | 0.0 /100 | #310 | Tragic 13.2% |
| Sioux | 0.0 /100 | #311 | Tragic 13.2% |
| Blackfeet | 0.0 /100 | #312 | Tragic 13.3% |
Demographics Similar to Mexicans by Divorced or Separated
In terms of divorced or separated, the demographic groups most similar to Mexicans are Slovak (12.2%, a difference of 0.0%), Immigrants from Costa Rica (12.2%, a difference of 0.010%), Kenyan (12.2%, a difference of 0.040%), Immigrants from Guatemala (12.2%, a difference of 0.11%), and Immigrants from Ghana (12.2%, a difference of 0.12%).
| Demographics | Rating | Rank | Divorced or Separated |
| South Americans | 28.6 /100 | #200 | Fair 12.2% |
| Guatemalans | 26.9 /100 | #201 | Fair 12.2% |
| Portuguese | 23.5 /100 | #202 | Fair 12.2% |
| Immigrants | Guatemala | 23.2 /100 | #203 | Fair 12.2% |
| Kenyans | 21.8 /100 | #204 | Fair 12.2% |
| Immigrants | Costa Rica | 21.3 /100 | #205 | Fair 12.2% |
| Slovaks | 21.0 /100 | #206 | Fair 12.2% |
| Mexicans | 21.0 /100 | #207 | Fair 12.2% |
| Immigrants | Ghana | 18.8 /100 | #208 | Poor 12.2% |
| Immigrants | Trinidad and Tobago | 17.8 /100 | #209 | Poor 12.2% |
| Slavs | 17.0 /100 | #210 | Poor 12.2% |
| Trinidadians and Tobagonians | 16.6 /100 | #211 | Poor 12.2% |
| Immigrants | Kenya | 16.5 /100 | #212 | Poor 12.2% |
| Immigrants | Eastern Africa | 16.2 /100 | #213 | Poor 12.2% |
| Immigrants | Argentina | 15.5 /100 | #214 | Poor 12.2% |