Chickasaw vs Immigrants from Portugal Female Unemployment
COMPARE
Chickasaw
Immigrants from Portugal
Female Unemployment
Female Unemployment Comparison
Chickasaw
Immigrants from Portugal
5.1%
FEMALE UNEMPLOYMENT
83.2/ 100
METRIC RATING
138th/ 347
METRIC RANK
5.8%
FEMALE UNEMPLOYMENT
0.2/ 100
METRIC RATING
258th/ 347
METRIC RANK
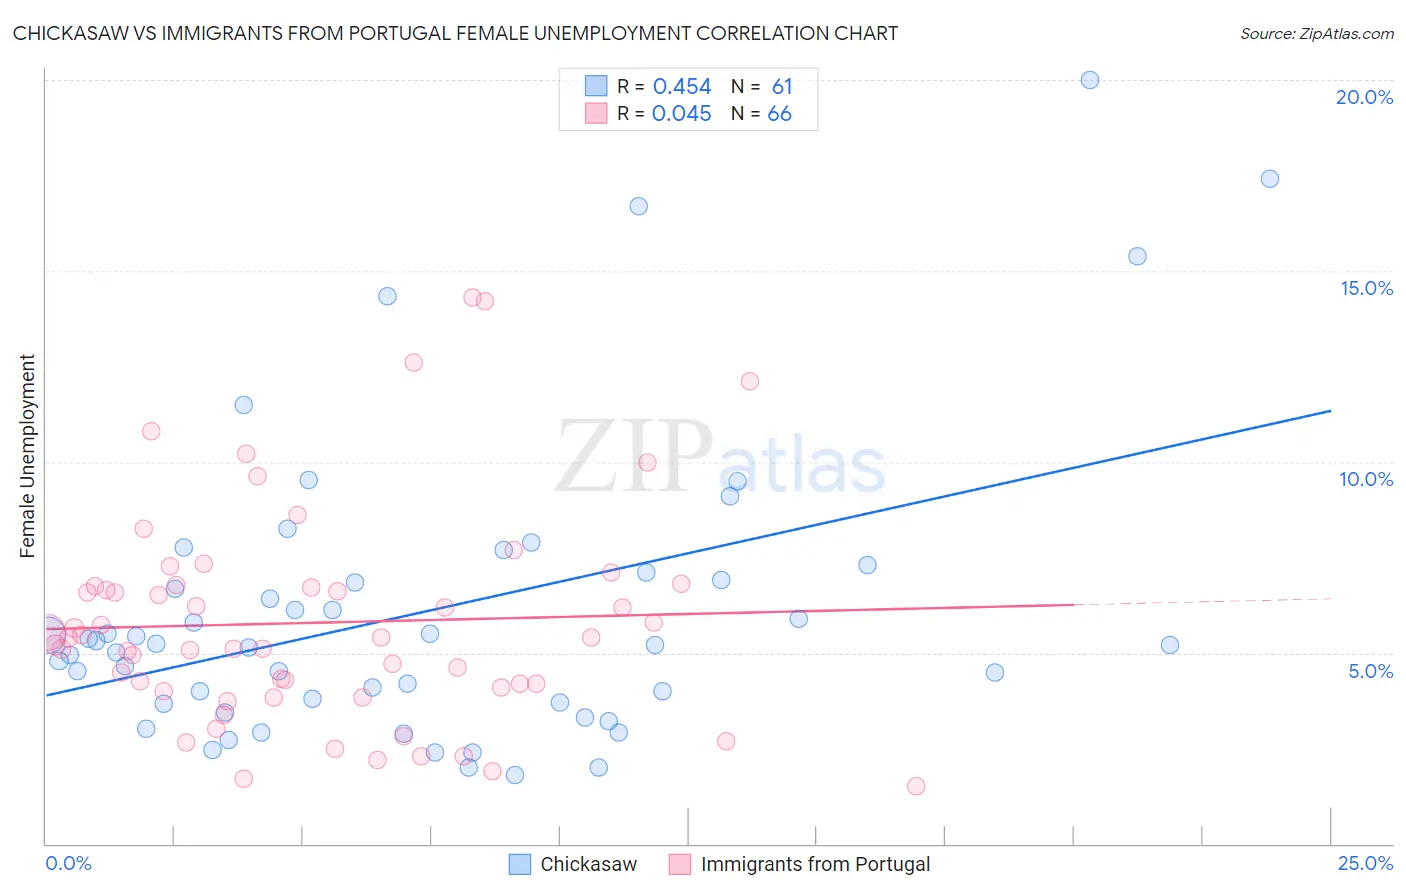
Chickasaw vs Immigrants from Portugal Female Unemployment Correlation Chart
The statistical analysis conducted on geographies consisting of 147,184,773 people shows a moderate positive correlation between the proportion of Chickasaw and unemploymnet rate among females in the United States with a correlation coefficient (R) of 0.454 and weighted average of 5.1%. Similarly, the statistical analysis conducted on geographies consisting of 174,363,409 people shows no correlation between the proportion of Immigrants from Portugal and unemploymnet rate among females in the United States with a correlation coefficient (R) of 0.045 and weighted average of 5.8%, a difference of 12.1%.
Female Unemployment Correlation Summary
| Measurement | Chickasaw | Immigrants from Portugal |
| Minimum | 1.8% | 1.5% |
| Maximum | 20.0% | 14.3% |
| Range | 18.2% | 12.8% |
| Mean | 6.1% | 5.8% |
| Median | 5.2% | 5.4% |
| Interquartile 25% (IQ1) | 3.7% | 4.1% |
| Interquartile 75% (IQ3) | 7.0% | 6.7% |
| Interquartile Range (IQR) | 3.3% | 2.7% |
| Standard Deviation (Sample) | 3.8% | 2.8% |
| Standard Deviation (Population) | 3.8% | 2.8% |
Similar Demographics by Female Unemployment
Demographics Similar to Chickasaw by Female Unemployment
In terms of female unemployment, the demographic groups most similar to Chickasaw are Immigrants from Eastern Asia (5.1%, a difference of 0.020%), Pakistani (5.1%, a difference of 0.060%), Immigrants from France (5.1%, a difference of 0.060%), Indian (Asian) (5.1%, a difference of 0.11%), and Immigrants from Latvia (5.1%, a difference of 0.15%).
| Demographics | Rating | Rank | Female Unemployment |
| Immigrants | Ethiopia | 85.4 /100 | #131 | Excellent 5.1% |
| Immigrants | Sri Lanka | 85.0 /100 | #132 | Excellent 5.1% |
| Immigrants | Hong Kong | 84.8 /100 | #133 | Excellent 5.1% |
| Immigrants | Eritrea | 84.6 /100 | #134 | Excellent 5.1% |
| Immigrants | Latvia | 84.6 /100 | #135 | Excellent 5.1% |
| Indians (Asian) | 84.2 /100 | #136 | Excellent 5.1% |
| Pakistanis | 83.8 /100 | #137 | Excellent 5.1% |
| Chickasaw | 83.2 /100 | #138 | Excellent 5.1% |
| Immigrants | Eastern Asia | 83.0 /100 | #139 | Excellent 5.1% |
| Immigrants | France | 82.7 /100 | #140 | Excellent 5.1% |
| Immigrants | Eastern Europe | 81.5 /100 | #141 | Excellent 5.1% |
| Palestinians | 80.8 /100 | #142 | Excellent 5.1% |
| Immigrants | Kazakhstan | 80.7 /100 | #143 | Excellent 5.1% |
| Immigrants | Jordan | 80.4 /100 | #144 | Excellent 5.1% |
| Immigrants | Oceania | 79.5 /100 | #145 | Good 5.2% |
Demographics Similar to Immigrants from Portugal by Female Unemployment
In terms of female unemployment, the demographic groups most similar to Immigrants from Portugal are Immigrants from Fiji (5.8%, a difference of 0.11%), Nigerian (5.8%, a difference of 0.14%), Kiowa (5.8%, a difference of 0.41%), Immigrants from Nigeria (5.8%, a difference of 0.44%), and Dutch West Indian (5.7%, a difference of 0.81%).
| Demographics | Rating | Rank | Female Unemployment |
| Assyrians/Chaldeans/Syriacs | 0.8 /100 | #251 | Tragic 5.6% |
| Cajuns | 0.7 /100 | #252 | Tragic 5.7% |
| Immigrants | Sierra Leone | 0.6 /100 | #253 | Tragic 5.7% |
| Immigrants | Immigrants | 0.6 /100 | #254 | Tragic 5.7% |
| Immigrants | Cameroon | 0.6 /100 | #255 | Tragic 5.7% |
| Sub-Saharan Africans | 0.4 /100 | #256 | Tragic 5.7% |
| Dutch West Indians | 0.3 /100 | #257 | Tragic 5.7% |
| Immigrants | Portugal | 0.2 /100 | #258 | Tragic 5.8% |
| Immigrants | Fiji | 0.2 /100 | #259 | Tragic 5.8% |
| Nigerians | 0.2 /100 | #260 | Tragic 5.8% |
| Kiowa | 0.1 /100 | #261 | Tragic 5.8% |
| Immigrants | Nigeria | 0.1 /100 | #262 | Tragic 5.8% |
| Immigrants | Azores | 0.1 /100 | #263 | Tragic 5.8% |
| Immigrants | Bahamas | 0.1 /100 | #264 | Tragic 5.8% |
| Blackfeet | 0.0 /100 | #265 | Tragic 5.9% |