Chickasaw vs Immigrants from Portugal In Labor Force | Age 25-29
COMPARE
Chickasaw
Immigrants from Portugal
In Labor Force | Age 25-29
In Labor Force | Age 25-29 Comparison
Chickasaw
Immigrants from Portugal
81.9%
IN LABOR FORCE | AGE 25-29
0.0/ 100
METRIC RATING
317th/ 347
METRIC RANK
84.6%
IN LABOR FORCE | AGE 25-29
34.7/ 100
METRIC RATING
187th/ 347
METRIC RANK
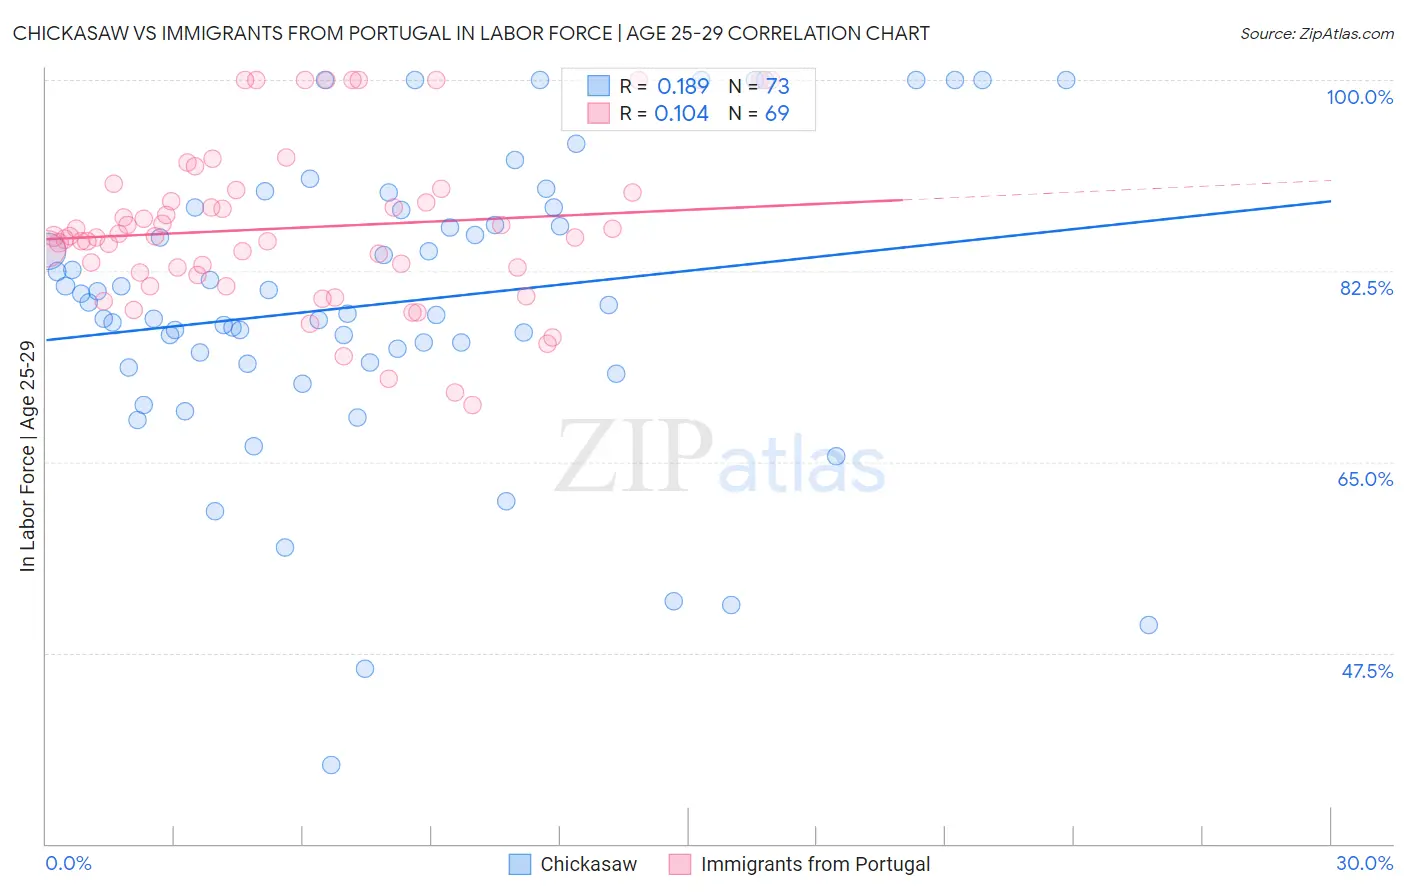
Chickasaw vs Immigrants from Portugal In Labor Force | Age 25-29 Correlation Chart
The statistical analysis conducted on geographies consisting of 147,700,460 people shows a poor positive correlation between the proportion of Chickasaw and labor force participation rate among population between the ages 25 and 29 in the United States with a correlation coefficient (R) of 0.189 and weighted average of 81.9%. Similarly, the statistical analysis conducted on geographies consisting of 174,743,638 people shows a poor positive correlation between the proportion of Immigrants from Portugal and labor force participation rate among population between the ages 25 and 29 in the United States with a correlation coefficient (R) of 0.104 and weighted average of 84.6%, a difference of 3.3%.
In Labor Force | Age 25-29 Correlation Summary
| Measurement | Chickasaw | Immigrants from Portugal |
| Minimum | 37.2% | 70.2% |
| Maximum | 100.0% | 100.0% |
| Range | 62.8% | 29.8% |
| Mean | 79.6% | 86.4% |
| Median | 79.3% | 85.7% |
| Interquartile 25% (IQ1) | 74.0% | 82.2% |
| Interquartile 75% (IQ3) | 88.2% | 89.8% |
| Interquartile Range (IQR) | 14.2% | 7.6% |
| Standard Deviation (Sample) | 13.5% | 7.4% |
| Standard Deviation (Population) | 13.4% | 7.3% |
Similar Demographics by In Labor Force | Age 25-29
Demographics Similar to Chickasaw by In Labor Force | Age 25-29
In terms of in labor force | age 25-29, the demographic groups most similar to Chickasaw are Comanche (81.9%, a difference of 0.010%), Mexican (81.9%, a difference of 0.070%), Immigrants from Mexico (82.0%, a difference of 0.16%), Seminole (81.7%, a difference of 0.23%), and Colville (81.6%, a difference of 0.28%).
| Demographics | Rating | Rank | In Labor Force | Age 25-29 |
| Osage | 0.0 /100 | #310 | Tragic 82.3% |
| Alaskan Athabascans | 0.0 /100 | #311 | Tragic 82.3% |
| Hispanics or Latinos | 0.0 /100 | #312 | Tragic 82.2% |
| Yaqui | 0.0 /100 | #313 | Tragic 82.2% |
| Cherokee | 0.0 /100 | #314 | Tragic 82.1% |
| Immigrants | Mexico | 0.0 /100 | #315 | Tragic 82.0% |
| Mexicans | 0.0 /100 | #316 | Tragic 81.9% |
| Chickasaw | 0.0 /100 | #317 | Tragic 81.9% |
| Comanche | 0.0 /100 | #318 | Tragic 81.9% |
| Seminole | 0.0 /100 | #319 | Tragic 81.7% |
| Colville | 0.0 /100 | #320 | Tragic 81.6% |
| Shoshone | 0.0 /100 | #321 | Tragic 81.6% |
| Kiowa | 0.0 /100 | #322 | Tragic 81.6% |
| Alaska Natives | 0.0 /100 | #323 | Tragic 81.6% |
| Houma | 0.0 /100 | #324 | Tragic 81.2% |
Demographics Similar to Immigrants from Portugal by In Labor Force | Age 25-29
In terms of in labor force | age 25-29, the demographic groups most similar to Immigrants from Portugal are Immigrants from Belgium (84.6%, a difference of 0.0%), Immigrants from Ukraine (84.5%, a difference of 0.010%), Immigrants from Denmark (84.6%, a difference of 0.020%), Moroccan (84.5%, a difference of 0.020%), and Immigrants from Kuwait (84.6%, a difference of 0.030%).
| Demographics | Rating | Rank | In Labor Force | Age 25-29 |
| Immigrants | South America | 42.9 /100 | #180 | Average 84.6% |
| Immigrants | Norway | 41.9 /100 | #181 | Average 84.6% |
| Europeans | 40.3 /100 | #182 | Average 84.6% |
| Scottish | 40.1 /100 | #183 | Average 84.6% |
| Immigrants | Kuwait | 38.2 /100 | #184 | Fair 84.6% |
| Immigrants | Denmark | 37.0 /100 | #185 | Fair 84.6% |
| Immigrants | Belgium | 35.0 /100 | #186 | Fair 84.6% |
| Immigrants | Portugal | 34.7 /100 | #187 | Fair 84.6% |
| Immigrants | Ukraine | 33.7 /100 | #188 | Fair 84.5% |
| Moroccans | 32.6 /100 | #189 | Fair 84.5% |
| Welsh | 31.1 /100 | #190 | Fair 84.5% |
| Zimbabweans | 28.7 /100 | #191 | Fair 84.5% |
| English | 25.8 /100 | #192 | Fair 84.5% |
| South American Indians | 25.0 /100 | #193 | Fair 84.5% |
| Portuguese | 21.2 /100 | #194 | Fair 84.4% |