German vs Immigrants from Nepal Single Male Poverty

COMPARE

German
Race
Ancestry
AfghanAfricanAlaska NativeAlaskan AthabascanAlbanianAleutAlsatianAmericanApacheArabArapahoArgentineanArmenianAssyrian/Chaldean/SyriacAustralianAustrianBahamianBangladeshiBarbadianBasqueBelgianBelizeanBermudanBhutaneseBlackfeetBolivianBrazilianBritishBritish West IndianBulgarianBurmeseCajunCambodianCanadianCape VerdeanCarpatho RusynCelticCentral AmericanCentral American IndianCherokeeCheyenneChickasawChileanChineseChippewaChoctawColombianColvilleComancheCosta RicanCreeCreekCroatianCrowCubanCypriotCzechCzechoslovakianDanishDelawareDominicanDutchDutch West IndianEastern EuropeanEcuadorianEgyptianEnglishEstonianEthiopianEuropeanFijianFilipinoFinnishFrenchFrench American IndianFrench CanadianGermanGerman RussianGhanaianGreekGuamanian/ChamorroGuatemalanGuyaneseHaitianHmongHonduranHopiHoumaHungarianIcelanderIndian (Asian)IndonesianInupiatIranianIraqiIrishIroquoisIsraeliItalianJamaicanJapaneseJordanianKenyanKiowaKoreanLaotianLatvianLebaneseLiberianLithuanianLumbeeLuxembourgerMacedonianMalaysianMalteseMarshalleseMenomineeMexicanMexican American IndianMongolianMoroccanNative HawaiianNavajoNepaleseNew ZealanderNicaraguanNigerianNorthern EuropeanNorwegianOkinawanOsageOttawaPaiutePakistaniPalestinianPanamanianParaguayanPennsylvania GermanPeruvianPimaPolishPortuguesePotawatomiPuebloPuerto RicanPuget Sound SalishRomanianRussianSalvadoranSamoanScandinavianScotch-IrishScottishSeminoleSenegaleseSerbianShoshoneSierra LeoneanSiouxSlavicSlovakSloveneSomaliSouth AfricanSouth AmericanSouth American IndianSoviet UnionSpaniardSpanishSpanish AmericanSpanish American IndianSri LankanSubsaharan AfricanSudaneseSwedishSwissSyrianTaiwaneseThaiTlingit-HaidaTohono O'OdhamTonganTrinidadian and TobagonianTsimshianTurkishU.S. Virgin IslanderUgandanUkrainianUruguayanUteVenezuelanVietnameseWelshWest IndianYakamaYaquiYugoslavianYumanYup'ikZimbabwean
Immigration
NonimmigrantsImmigrantsAfghanistanAfricaAlbaniaArgentinaArmeniaAsiaAustraliaAustriaBahamasBangladeshBarbadosBelarusBelgiumBelizeBoliviaBosnia and HerzegovinaBrazilBulgariaBurma/MyanmarCabo VerdeCambodiaCameroonCanadaCaribbeanCentral AmericaChileChinaColombiaCongoCosta RicaCroatiaCubaCzechoslovakiaDenmarkDominicaDominican RepublicEastern AfricaEastern AsiaEastern EuropeEcuadorEgyptEl SalvadorEnglandEritreaEthiopiaEuropeFijiFranceGermanyGhanaGreeceGrenadaGuatemalaGuyanaHaitiHondurasHong KongHungaryIndiaIndonesiaIranIraqIrelandIsraelItalyJamaicaJapanJordanKazakhstanKenyaKoreaKuwaitLaosLatin AmericaLatviaLebanonLiberiaLithuaniaMalaysiaMexicoMicronesiaMiddle AfricaMoldovaMoroccoNetherlandsNicaraguaNigeriaNorth AmericaNorth MacedoniaNorthern AfricaNorthern EuropeNorwayOceaniaPakistanPanamaPeruPhilippinesPolandPortugalRomaniaRussiaSaudi ArabiaScotlandSenegalSerbiaSierra LeoneSingaporeSomaliaSouth AfricaSouth AmericaSouth Central AsiaSouth Eastern AsiaSouthern EuropeSpainSri LankaSt. Vincent and the GrenadinesSudanSwedenSwitzerlandSyriaTaiwanThailandTrinidad and TobagoTurkeyUgandaUkraineUruguayUzbekistanVenezuelaVietnamWest IndiesWestern AfricaWestern AsiaWestern EuropeYemenZaireZimbabweAzores
Immigrants from Nepal
Race
Ancestry
AfghanAfricanAlaska NativeAlaskan AthabascanAlbanianAleutAlsatianAmericanApacheArabArapahoArgentineanArmenianAssyrian/Chaldean/SyriacAustralianAustrianBahamianBangladeshiBarbadianBasqueBelgianBelizeanBermudanBhutaneseBlackfeetBolivianBrazilianBritishBritish West IndianBulgarianBurmeseCajunCambodianCanadianCape VerdeanCarpatho RusynCelticCentral AmericanCentral American IndianCherokeeCheyenneChickasawChileanChineseChippewaChoctawColombianColvilleComancheCosta RicanCreeCreekCroatianCrowCubanCypriotCzechCzechoslovakianDanishDelawareDominicanDutchDutch West IndianEastern EuropeanEcuadorianEgyptianEnglishEstonianEthiopianEuropeanFijianFilipinoFinnishFrenchFrench American IndianFrench CanadianGerman RussianGhanaianGreekGuamanian/ChamorroGuatemalanGuyaneseHaitianHmongHonduranHopiHoumaHungarianIcelanderIndian (Asian)IndonesianInupiatIranianIraqiIrishIroquoisIsraeliItalianJamaicanJapaneseJordanianKenyanKiowaKoreanLaotianLatvianLebaneseLiberianLithuanianLumbeeLuxembourgerMacedonianMalaysianMalteseMarshalleseMenomineeMexicanMexican American IndianMongolianMoroccanNative HawaiianNavajoNepaleseNew ZealanderNicaraguanNigerianNorthern EuropeanNorwegianOkinawanOsageOttawaPaiutePakistaniPalestinianPanamanianParaguayanPennsylvania GermanPeruvianPimaPolishPortuguesePotawatomiPuebloPuerto RicanPuget Sound SalishRomanianRussianSalvadoranSamoanScandinavianScotch-IrishScottishSeminoleSenegaleseSerbianShoshoneSierra LeoneanSiouxSlavicSlovakSloveneSomaliSouth AfricanSouth AmericanSouth American IndianSoviet UnionSpaniardSpanishSpanish AmericanSpanish American IndianSri LankanSubsaharan AfricanSudaneseSwedishSwissSyrianTaiwaneseThaiTlingit-HaidaTohono O'OdhamTonganTrinidadian and TobagonianTsimshianTurkishU.S. Virgin IslanderUgandanUkrainianUruguayanUteVenezuelanVietnameseWelshWest IndianYakamaYaquiYugoslavianYumanYup'ikZimbabwean
Immigration
NonimmigrantsImmigrantsAfghanistanAfricaAlbaniaArgentinaArmeniaAsiaAustraliaAustriaBahamasBangladeshBarbadosBelarusBelgiumBelizeBoliviaBosnia and HerzegovinaBrazilBulgariaBurma/MyanmarCabo VerdeCambodiaCameroonCanadaCaribbeanCentral AmericaChileChinaColombiaCongoCosta RicaCroatiaCubaCzechoslovakiaDenmarkDominicaDominican RepublicEastern AfricaEastern AsiaEastern EuropeEcuadorEgyptEl SalvadorEnglandEritreaEthiopiaEuropeFijiFranceGermanyGhanaGreeceGrenadaGuatemalaGuyanaHaitiHondurasHong KongHungaryIndiaIndonesiaIranIraqIrelandIsraelItalyJamaicaJapanJordanKazakhstanKenyaKoreaKuwaitLaosLatin AmericaLatviaLebanonLiberiaLithuaniaMalaysiaMexicoMicronesiaMiddle AfricaMoldovaMoroccoNepalNetherlandsNicaraguaNigeriaNorth AmericaNorth MacedoniaNorthern AfricaNorthern EuropeNorwayOceaniaPakistanPanamaPeruPhilippinesPolandPortugalRomaniaRussiaSaudi ArabiaScotlandSenegalSerbiaSierra LeoneSingaporeSomaliaSouth AfricaSouth AmericaSouth Central AsiaSouth Eastern AsiaSouthern EuropeSpainSri LankaSt. Vincent and the GrenadinesSudanSwedenSwitzerlandSyriaTaiwanThailandTrinidad and TobagoTurkeyUgandaUkraineUruguayUzbekistanVenezuelaVietnamWest IndiesWestern AfricaWestern AsiaWestern EuropeYemenZaireZimbabweAzores
Single Male Poverty
Income
Poverty
Unemployment
Labor Participation
Family Structure
Vehicle Availability
Education Level
Disability

Single Male Poverty Comparison

Germans

Immigrants from Nepal

Tragic
Exceptional
13.9%
SINGLE MALE POVERTY
0.1/ 100
METRIC RATING
267th/ 347
METRIC RANK
11.9%
SINGLE MALE POVERTY
99.6/ 100
METRIC RATING
70th/ 347
METRIC RANK

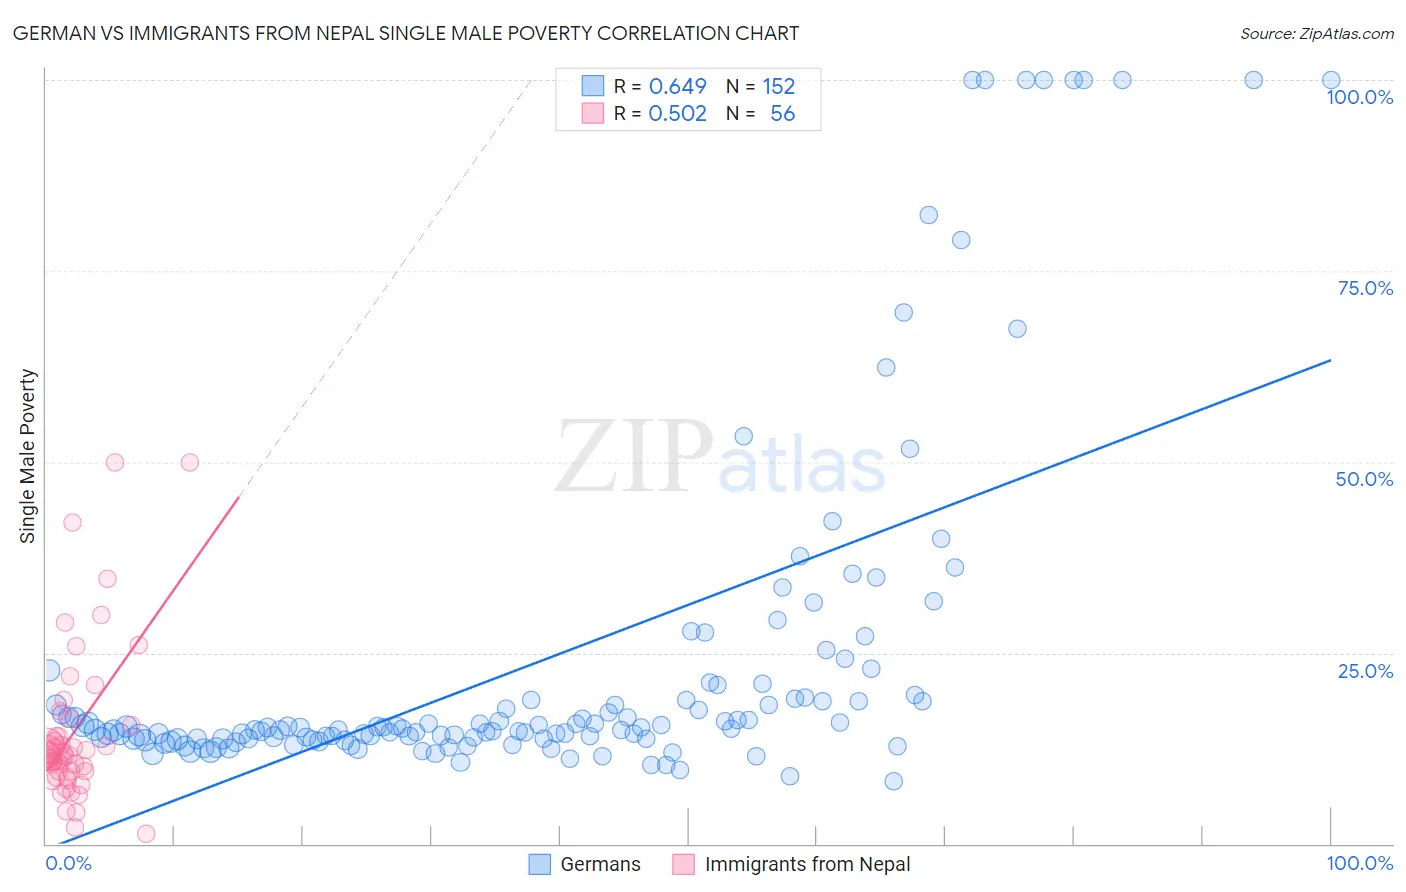
German vs Immigrants from Nepal Single Male Poverty Correlation Chart

The statistical analysis conducted on geographies consisting of 476,219,018 people shows a significant positive correlation between the proportion of Germans and poverty level among single males in the United States with a correlation coefficient (R) of 0.649 and weighted average of 13.9%. Similarly, the statistical analysis conducted on geographies consisting of 173,608,756 people shows a substantial positive correlation between the proportion of Immigrants from Nepal and poverty level among single males in the United States with a correlation coefficient (R) of 0.502 and weighted average of 11.9%, a difference of 17.4%.
German vs Immigrants from Nepal Single Male Poverty

Single Male Poverty Correlation Summary

MeasurementGermanImmigrants from Nepal
Minimum8.2%1.2%
Maximum100.0%50.0%
Range91.8%48.8%
Mean23.9%14.6%
Median15.1%11.6%
Interquartile 25% (IQ1)13.8%9.4%
Interquartile 75% (IQ3)19.0%14.8%
Interquartile Range (IQR)5.3%5.4%
Standard Deviation (Sample)22.7%10.3%
Standard Deviation (Population)22.7%10.2%

Similar Demographics by Single Male Poverty

Demographics Similar to Germans by Single Male Poverty

In terms of single male poverty, the demographic groups most similar to Germans are Immigrants from Mexico (13.9%, a difference of 0.070%), Immigrants from Cabo Verde (13.9%, a difference of 0.16%), Scottish (14.0%, a difference of 0.22%), Immigrants from Saudi Arabia (14.0%, a difference of 0.23%), and Irish (14.0%, a difference of 0.27%).
DemographicsRating | RankSingle Male Poverty
Swiss
0.3
/100
|
#260
Tragic
13.8%
Hungarians
0.3
/100
|
#261
Tragic
13.8%
Fijians
0.3
/100
|
#262
Tragic
13.8%
Cape Verdeans
0.2
/100
|
#263
Tragic
13.8%
West Indians
0.2
/100
|
#264
Tragic
13.8%
Immigrants | Congo
0.2
/100
|
#265
Tragic
13.9%
Immigrants | Cabo Verde
0.1
/100
|
#266
Tragic
13.9%
Germans
0.1
/100
|
#267
Tragic
13.9%
Immigrants | Mexico
0.1
/100
|
#268
Tragic
13.9%
Scottish
0.1
/100
|
#269
Tragic
14.0%
Immigrants | Saudi Arabia
0.1
/100
|
#270
Tragic
14.0%
Irish
0.1
/100
|
#271
Tragic
14.0%
Mexicans
0.1
/100
|
#272
Tragic
14.0%
Welsh
0.1
/100
|
#273
Tragic
14.0%
Hondurans
0.1
/100
|
#274
Tragic
14.0%

Demographics Similar to Immigrants from Nepal by Single Male Poverty

In terms of single male poverty, the demographic groups most similar to Immigrants from Nepal are Immigrants from Russia (11.9%, a difference of 0.020%), Immigrants from Croatia (11.9%, a difference of 0.040%), Immigrants from Ukraine (11.9%, a difference of 0.060%), Immigrants from Greece (11.9%, a difference of 0.060%), and Laotian (11.9%, a difference of 0.080%).
DemographicsRating | RankSingle Male Poverty
Immigrants | Belarus
99.7
/100
|
#63
Exceptional
11.8%
Immigrants | Eastern Europe
99.6
/100
|
#64
Exceptional
11.8%
Laotians
99.6
/100
|
#65
Exceptional
11.9%
Immigrants | Uruguay
99.6
/100
|
#66
Exceptional
11.9%
Immigrants | Ukraine
99.6
/100
|
#67
Exceptional
11.9%
Immigrants | Croatia
99.6
/100
|
#68
Exceptional
11.9%
Immigrants | Russia
99.6
/100
|
#69
Exceptional
11.9%
Immigrants | Nepal
99.6
/100
|
#70
Exceptional
11.9%
Immigrants | Greece
99.6
/100
|
#71
Exceptional
11.9%
Immigrants | Argentina
99.5
/100
|
#72
Exceptional
11.9%
Argentineans
99.5
/100
|
#73
Exceptional
11.9%
Chileans
99.5
/100
|
#74
Exceptional
11.9%
Uruguayans
99.4
/100
|
#75
Exceptional
11.9%
Immigrants | Northern Africa
99.4
/100
|
#76
Exceptional
11.9%
Immigrants | Malaysia
99.2
/100
|
#77
Exceptional
12.0%