Panamanian vs Immigrants from Nepal Single Male Poverty
COMPARE
Panamanian
Immigrants from Nepal
Single Male Poverty
Single Male Poverty Comparison
Panamanians
Immigrants from Nepal
12.9%
SINGLE MALE POVERTY
37.6/ 100
METRIC RATING
181st/ 347
METRIC RANK
11.9%
SINGLE MALE POVERTY
99.6/ 100
METRIC RATING
70th/ 347
METRIC RANK
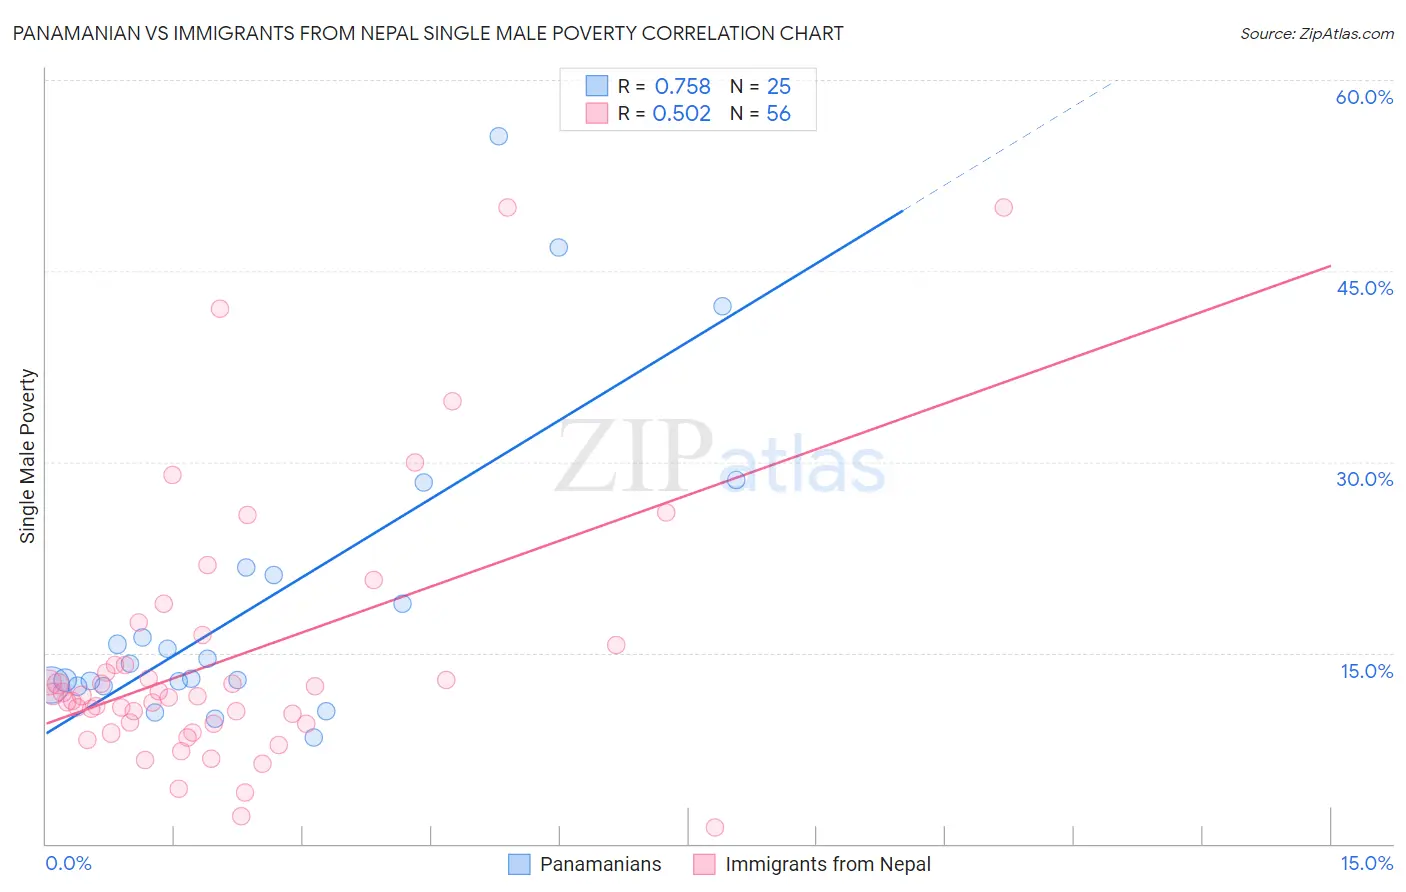
Panamanian vs Immigrants from Nepal Single Male Poverty Correlation Chart
The statistical analysis conducted on geographies consisting of 259,773,019 people shows a strong positive correlation between the proportion of Panamanians and poverty level among single males in the United States with a correlation coefficient (R) of 0.758 and weighted average of 12.9%. Similarly, the statistical analysis conducted on geographies consisting of 173,608,756 people shows a substantial positive correlation between the proportion of Immigrants from Nepal and poverty level among single males in the United States with a correlation coefficient (R) of 0.502 and weighted average of 11.9%, a difference of 8.6%.
Single Male Poverty Correlation Summary
| Measurement | Panamanian | Immigrants from Nepal |
| Minimum | 8.3% | 1.2% |
| Maximum | 55.6% | 50.0% |
| Range | 47.2% | 48.8% |
| Mean | 19.2% | 14.6% |
| Median | 14.1% | 11.6% |
| Interquartile 25% (IQ1) | 12.4% | 9.4% |
| Interquartile 75% (IQ3) | 21.4% | 14.8% |
| Interquartile Range (IQR) | 8.9% | 5.4% |
| Standard Deviation (Sample) | 12.2% | 10.3% |
| Standard Deviation (Population) | 12.0% | 10.2% |
Similar Demographics by Single Male Poverty
Demographics Similar to Panamanians by Single Male Poverty
In terms of single male poverty, the demographic groups most similar to Panamanians are Immigrants from North America (12.9%, a difference of 0.010%), Moroccan (12.9%, a difference of 0.040%), Israeli (12.9%, a difference of 0.19%), Immigrants from West Indies (12.9%, a difference of 0.26%), and Immigrants from Trinidad and Tobago (12.9%, a difference of 0.29%).
| Demographics | Rating | Rank | Single Male Poverty |
| Costa Ricans | 50.0 /100 | #174 | Average 12.8% |
| Croatians | 48.9 /100 | #175 | Average 12.8% |
| Syrians | 48.4 /100 | #176 | Average 12.8% |
| Immigrants | Canada | 44.8 /100 | #177 | Average 12.8% |
| Immigrants | Switzerland | 43.1 /100 | #178 | Average 12.8% |
| Israelis | 41.0 /100 | #179 | Average 12.9% |
| Immigrants | North America | 37.7 /100 | #180 | Fair 12.9% |
| Panamanians | 37.6 /100 | #181 | Fair 12.9% |
| Moroccans | 36.8 /100 | #182 | Fair 12.9% |
| Immigrants | West Indies | 33.0 /100 | #183 | Fair 12.9% |
| Immigrants | Trinidad and Tobago | 32.5 /100 | #184 | Fair 12.9% |
| Norwegians | 32.0 /100 | #185 | Fair 12.9% |
| Nigerians | 31.9 /100 | #186 | Fair 12.9% |
| Immigrants | Kuwait | 31.9 /100 | #187 | Fair 12.9% |
| Macedonians | 31.5 /100 | #188 | Fair 12.9% |
Demographics Similar to Immigrants from Nepal by Single Male Poverty
In terms of single male poverty, the demographic groups most similar to Immigrants from Nepal are Immigrants from Russia (11.9%, a difference of 0.020%), Immigrants from Croatia (11.9%, a difference of 0.040%), Immigrants from Ukraine (11.9%, a difference of 0.060%), Immigrants from Greece (11.9%, a difference of 0.060%), and Laotian (11.9%, a difference of 0.080%).
| Demographics | Rating | Rank | Single Male Poverty |
| Immigrants | Belarus | 99.7 /100 | #63 | Exceptional 11.8% |
| Immigrants | Eastern Europe | 99.6 /100 | #64 | Exceptional 11.8% |
| Laotians | 99.6 /100 | #65 | Exceptional 11.9% |
| Immigrants | Uruguay | 99.6 /100 | #66 | Exceptional 11.9% |
| Immigrants | Ukraine | 99.6 /100 | #67 | Exceptional 11.9% |
| Immigrants | Croatia | 99.6 /100 | #68 | Exceptional 11.9% |
| Immigrants | Russia | 99.6 /100 | #69 | Exceptional 11.9% |
| Immigrants | Nepal | 99.6 /100 | #70 | Exceptional 11.9% |
| Immigrants | Greece | 99.6 /100 | #71 | Exceptional 11.9% |
| Immigrants | Argentina | 99.5 /100 | #72 | Exceptional 11.9% |
| Argentineans | 99.5 /100 | #73 | Exceptional 11.9% |
| Chileans | 99.5 /100 | #74 | Exceptional 11.9% |
| Uruguayans | 99.4 /100 | #75 | Exceptional 11.9% |
| Immigrants | Northern Africa | 99.4 /100 | #76 | Exceptional 11.9% |
| Immigrants | Malaysia | 99.2 /100 | #77 | Exceptional 12.0% |