Celtic vs British West Indian Median Household Income
COMPARE
Celtic
British West Indian
Median Household Income
Median Household Income Comparison
Celtics
British West Indians
$83,193
MEDIAN HOUSEHOLD INCOME
22.7/ 100
METRIC RATING
205th/ 347
METRIC RANK
$75,647
MEDIAN HOUSEHOLD INCOME
0.2/ 100
METRIC RATING
274th/ 347
METRIC RANK
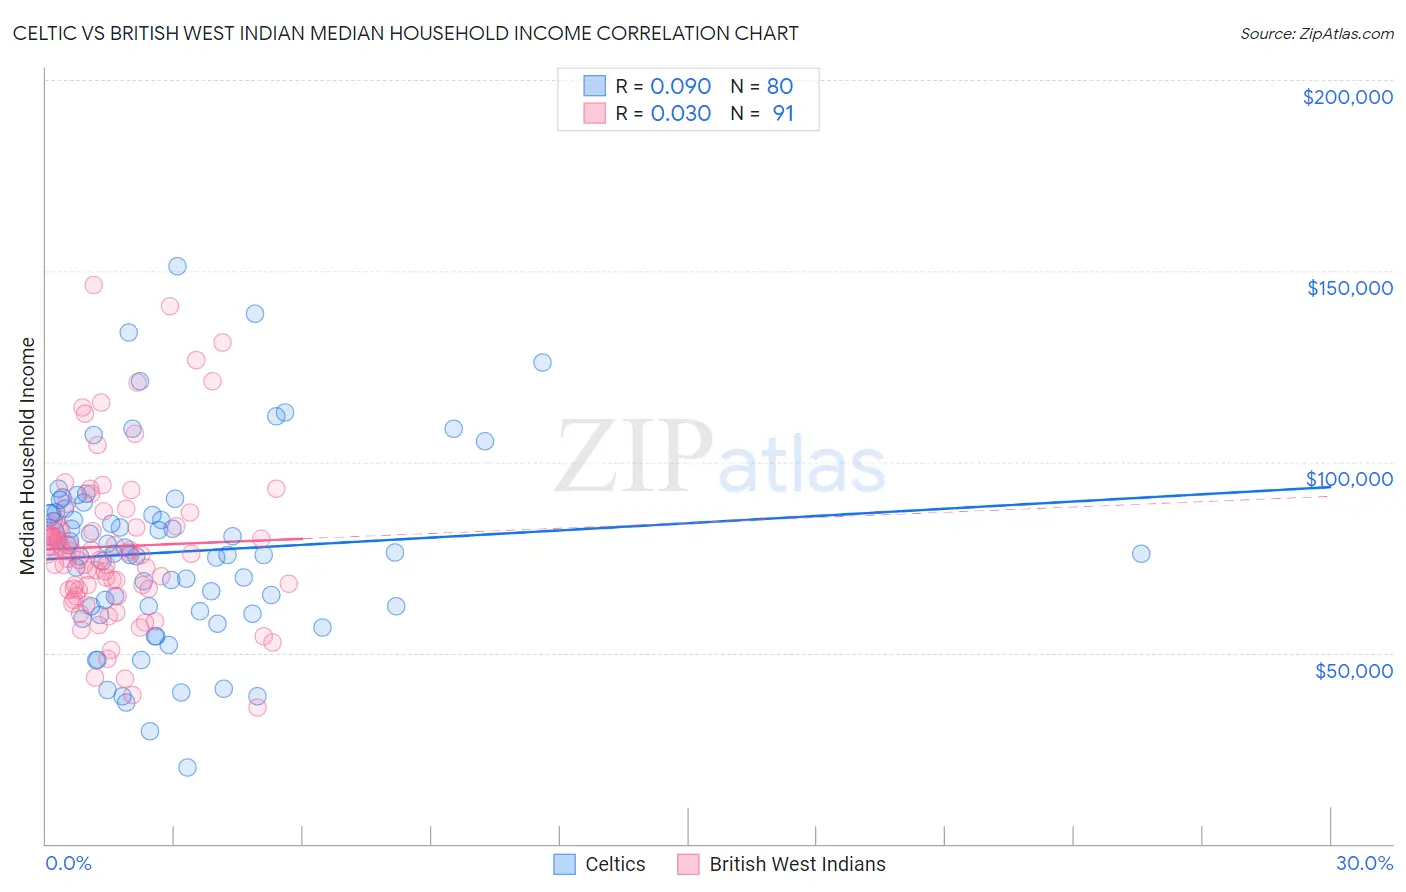
Celtic vs British West Indian Median Household Income Correlation Chart
The statistical analysis conducted on geographies consisting of 168,842,689 people shows a slight positive correlation between the proportion of Celtics and median household income in the United States with a correlation coefficient (R) of 0.090 and weighted average of $83,193. Similarly, the statistical analysis conducted on geographies consisting of 152,617,098 people shows no correlation between the proportion of British West Indians and median household income in the United States with a correlation coefficient (R) of 0.030 and weighted average of $75,647, a difference of 10.0%.
Median Household Income Correlation Summary
| Measurement | Celtic | British West Indian |
| Minimum | $19,921 | $35,840 |
| Maximum | $151,161 | $146,303 |
| Range | $131,240 | $110,463 |
| Mean | $76,393 | $77,834 |
| Median | $75,866 | $75,947 |
| Interquartile 25% (IQ1) | $61,507 | $66,444 |
| Interquartile 75% (IQ3) | $86,536 | $83,003 |
| Interquartile Range (IQR) | $25,028 | $16,558 |
| Standard Deviation (Sample) | $24,415 | $20,857 |
| Standard Deviation (Population) | $24,262 | $20,742 |
Similar Demographics by Median Household Income
Demographics Similar to Celtics by Median Household Income
In terms of median household income, the demographic groups most similar to Celtics are Immigrants from Africa ($83,289, a difference of 0.11%), Immigrants from Cambodia ($83,304, a difference of 0.13%), Immigrants from Kenya ($83,068, a difference of 0.15%), Immigrants from Thailand ($83,327, a difference of 0.16%), and Tsimshian ($83,346, a difference of 0.18%).
| Demographics | Rating | Rank | Median Household Income |
| Japanese | 25.1 /100 | #198 | Fair $83,395 |
| Germans | 24.6 /100 | #199 | Fair $83,358 |
| Tsimshian | 24.5 /100 | #200 | Fair $83,346 |
| Spanish | 24.4 /100 | #201 | Fair $83,343 |
| Immigrants | Thailand | 24.3 /100 | #202 | Fair $83,327 |
| Immigrants | Cambodia | 24.0 /100 | #203 | Fair $83,304 |
| Immigrants | Africa | 23.8 /100 | #204 | Fair $83,289 |
| Celtics | 22.7 /100 | #205 | Fair $83,193 |
| Immigrants | Kenya | 21.3 /100 | #206 | Fair $83,068 |
| Dutch | 20.3 /100 | #207 | Fair $82,971 |
| French Canadians | 18.7 /100 | #208 | Poor $82,810 |
| Immigrants | Iraq | 16.7 /100 | #209 | Poor $82,594 |
| Immigrants | Uruguay | 16.4 /100 | #210 | Poor $82,560 |
| Salvadorans | 15.4 /100 | #211 | Poor $82,449 |
| Venezuelans | 15.3 /100 | #212 | Poor $82,432 |
Demographics Similar to British West Indians by Median Household Income
In terms of median household income, the demographic groups most similar to British West Indians are Liberian ($75,667, a difference of 0.030%), Immigrants from Micronesia ($75,574, a difference of 0.10%), Somali ($75,782, a difference of 0.18%), Pennsylvania German ($75,814, a difference of 0.22%), and Hmong ($75,839, a difference of 0.25%).
| Demographics | Rating | Rank | Median Household Income |
| German Russians | 0.3 /100 | #267 | Tragic $75,856 |
| Immigrants | Jamaica | 0.3 /100 | #268 | Tragic $75,851 |
| Cape Verdeans | 0.3 /100 | #269 | Tragic $75,848 |
| Hmong | 0.3 /100 | #270 | Tragic $75,839 |
| Pennsylvania Germans | 0.3 /100 | #271 | Tragic $75,814 |
| Somalis | 0.3 /100 | #272 | Tragic $75,782 |
| Liberians | 0.2 /100 | #273 | Tragic $75,667 |
| British West Indians | 0.2 /100 | #274 | Tragic $75,647 |
| Immigrants | Micronesia | 0.2 /100 | #275 | Tragic $75,574 |
| Immigrants | Latin America | 0.2 /100 | #276 | Tragic $75,420 |
| Spanish Americans | 0.2 /100 | #277 | Tragic $75,386 |
| Osage | 0.2 /100 | #278 | Tragic $75,240 |
| Immigrants | Guatemala | 0.2 /100 | #279 | Tragic $75,123 |
| Senegalese | 0.2 /100 | #280 | Tragic $74,999 |
| Immigrants | Liberia | 0.1 /100 | #281 | Tragic $74,896 |