Immigrants from Germany vs British West Indian Single Male Poverty
COMPARE
Immigrants from Germany
British West Indian
Single Male Poverty
Single Male Poverty Comparison
Immigrants from Germany
British West Indians
13.4%
SINGLE MALE POVERTY
2.1/ 100
METRIC RATING
241st/ 347
METRIC RANK
13.4%
SINGLE MALE POVERTY
3.4/ 100
METRIC RATING
237th/ 347
METRIC RANK
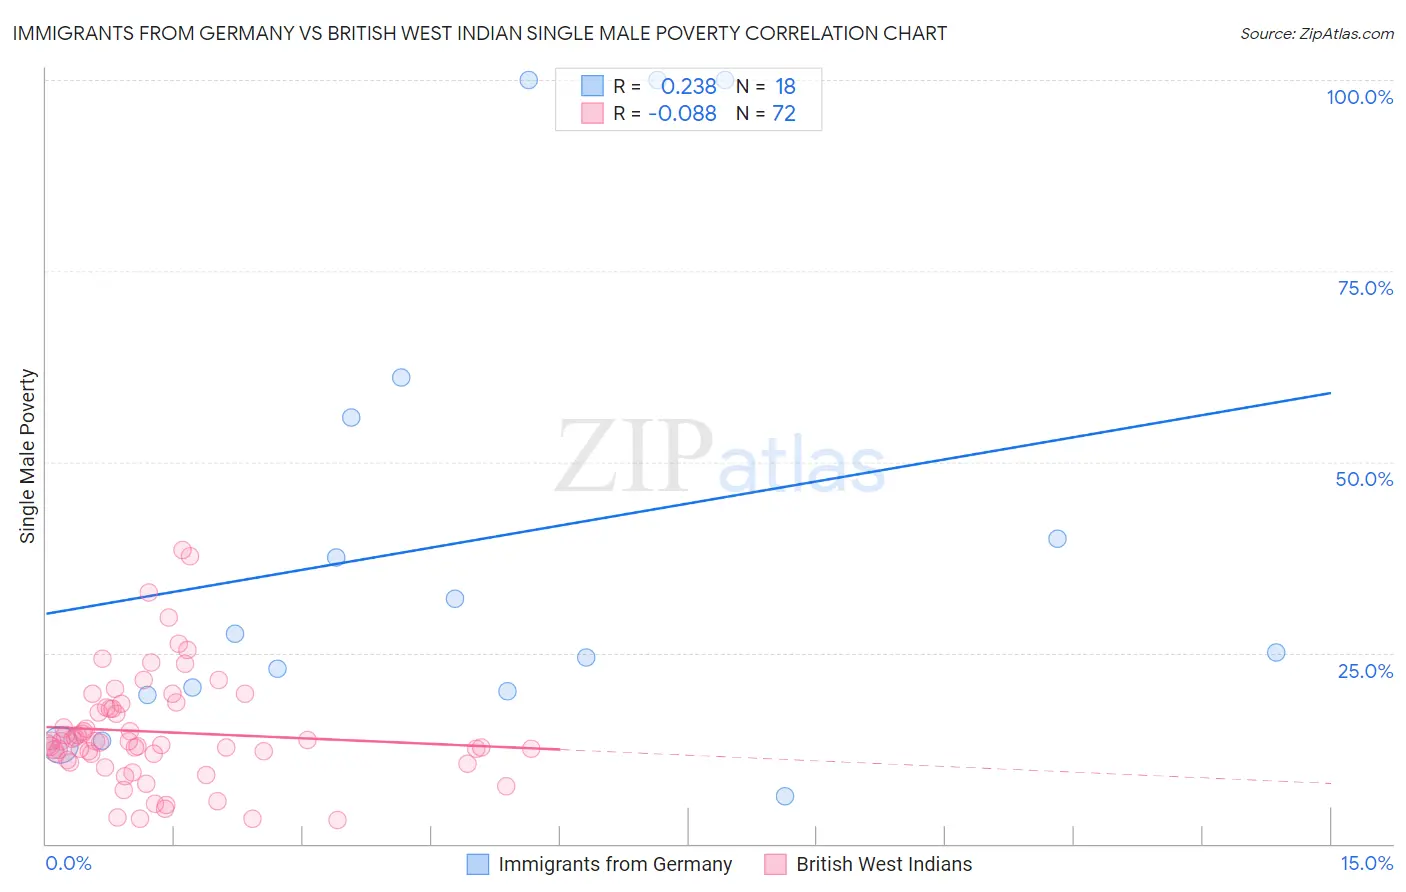
Immigrants from Germany vs British West Indian Single Male Poverty Correlation Chart
The statistical analysis conducted on geographies consisting of 402,484,283 people shows a weak positive correlation between the proportion of Immigrants from Germany and poverty level among single males in the United States with a correlation coefficient (R) of 0.238 and weighted average of 13.4%. Similarly, the statistical analysis conducted on geographies consisting of 145,852,012 people shows a slight negative correlation between the proportion of British West Indians and poverty level among single males in the United States with a correlation coefficient (R) of -0.088 and weighted average of 13.4%, a difference of 0.60%.
Single Male Poverty Correlation Summary
| Measurement | Immigrants from Germany | British West Indian |
| Minimum | 6.2% | 3.1% |
| Maximum | 100.0% | 38.5% |
| Range | 93.8% | 35.3% |
| Mean | 39.9% | 14.6% |
| Median | 26.2% | 13.3% |
| Interquartile 25% (IQ1) | 19.9% | 11.3% |
| Interquartile 75% (IQ3) | 55.8% | 17.8% |
| Interquartile Range (IQR) | 35.9% | 6.4% |
| Standard Deviation (Sample) | 30.9% | 7.2% |
| Standard Deviation (Population) | 30.1% | 7.2% |
Demographics Similar to Immigrants from Germany and British West Indians by Single Male Poverty
In terms of single male poverty, the demographic groups most similar to Immigrants from Germany are Carpatho Rusyn (13.4%, a difference of 0.010%), Barbadian (13.4%, a difference of 0.060%), Belizean (13.4%, a difference of 0.11%), Immigrants from Senegal (13.5%, a difference of 0.33%), and Czechoslovakian (13.4%, a difference of 0.42%). Similarly, the demographic groups most similar to British West Indians are Luxembourger (13.4%, a difference of 0.060%), Immigrants from Ghana (13.4%, a difference of 0.10%), Bangladeshi (13.3%, a difference of 0.11%), Czechoslovakian (13.4%, a difference of 0.18%), and British (13.3%, a difference of 0.21%).
| Demographics | Rating | Rank | Single Male Poverty |
| Europeans | 6.2 /100 | #229 | Tragic 13.3% |
| Ghanaians | 6.1 /100 | #230 | Tragic 13.3% |
| Slavs | 5.3 /100 | #231 | Tragic 13.3% |
| Immigrants | Caribbean | 5.0 /100 | #232 | Tragic 13.3% |
| British | 4.0 /100 | #233 | Tragic 13.3% |
| Canadians | 4.0 /100 | #234 | Tragic 13.3% |
| Bangladeshis | 3.7 /100 | #235 | Tragic 13.3% |
| Luxembourgers | 3.6 /100 | #236 | Tragic 13.4% |
| British West Indians | 3.4 /100 | #237 | Tragic 13.4% |
| Immigrants | Ghana | 3.2 /100 | #238 | Tragic 13.4% |
| Czechoslovakians | 3.0 /100 | #239 | Tragic 13.4% |
| Belizeans | 2.3 /100 | #240 | Tragic 13.4% |
| Immigrants | Germany | 2.1 /100 | #241 | Tragic 13.4% |
| Carpatho Rusyns | 2.1 /100 | #242 | Tragic 13.4% |
| Barbadians | 2.1 /100 | #243 | Tragic 13.4% |
| Immigrants | Senegal | 1.7 /100 | #244 | Tragic 13.5% |
| Immigrants | Latin America | 1.3 /100 | #245 | Tragic 13.5% |
| Immigrants | Micronesia | 1.2 /100 | #246 | Tragic 13.5% |
| Belgians | 1.2 /100 | #247 | Tragic 13.5% |
| Czechs | 1.2 /100 | #248 | Tragic 13.5% |
| Spanish | 1.0 /100 | #249 | Tragic 13.6% |