Celtic vs British West Indian Bachelor's Degree
COMPARE
Celtic
British West Indian
Bachelor's Degree
Bachelor's Degree Comparison
Celtics
British West Indians
37.0%
BACHELOR'S DEGREE
29.5/ 100
METRIC RATING
196th/ 347
METRIC RANK
34.5%
BACHELOR'S DEGREE
2.5/ 100
METRIC RATING
239th/ 347
METRIC RANK
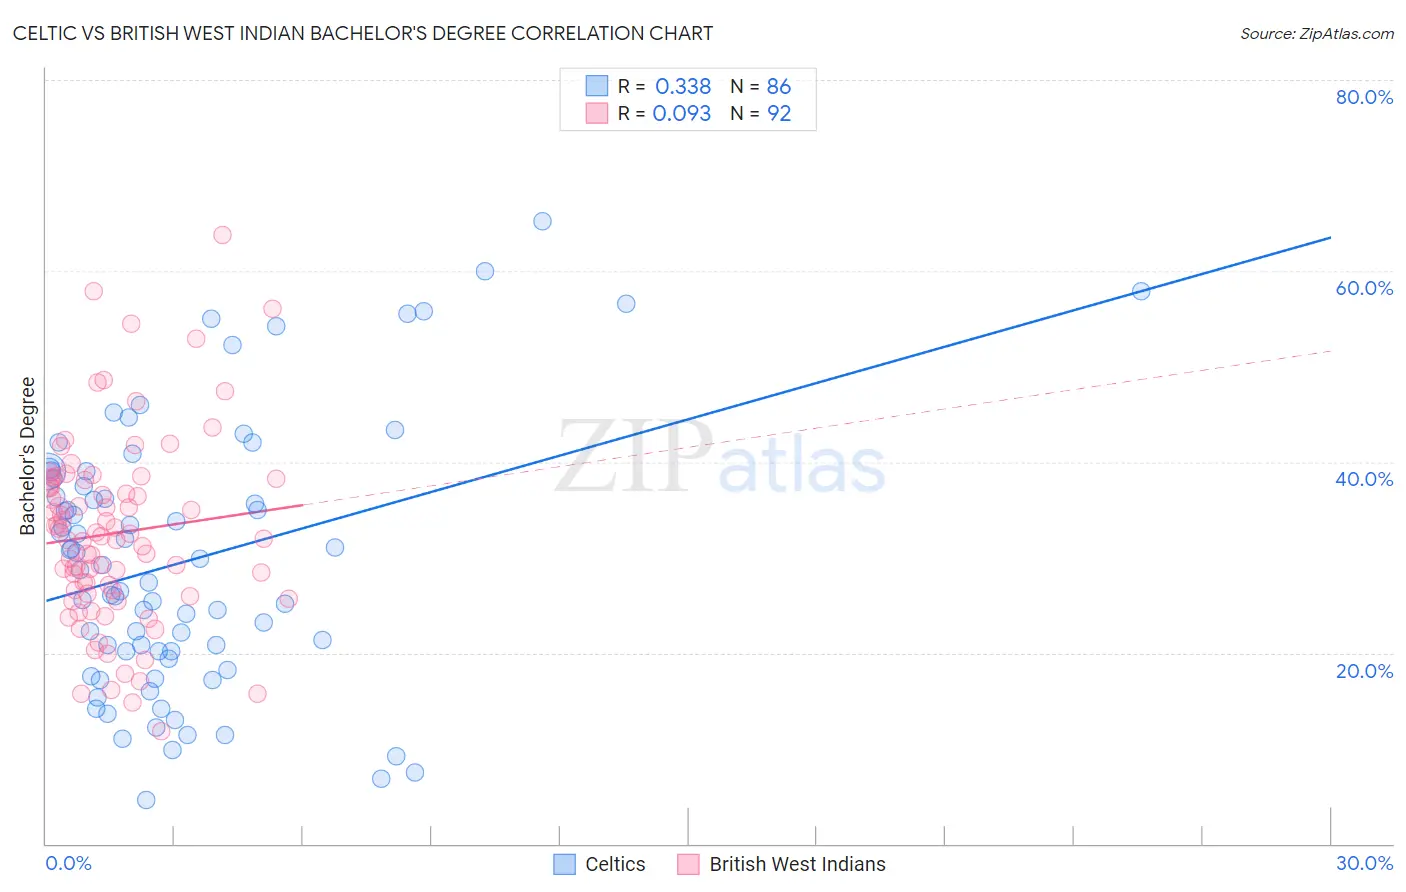
Celtic vs British West Indian Bachelor's Degree Correlation Chart
The statistical analysis conducted on geographies consisting of 168,877,213 people shows a mild positive correlation between the proportion of Celtics and percentage of population with at least bachelor's degree education in the United States with a correlation coefficient (R) of 0.338 and weighted average of 37.0%. Similarly, the statistical analysis conducted on geographies consisting of 152,683,655 people shows a slight positive correlation between the proportion of British West Indians and percentage of population with at least bachelor's degree education in the United States with a correlation coefficient (R) of 0.093 and weighted average of 34.5%, a difference of 7.5%.
Bachelor's Degree Correlation Summary
| Measurement | Celtic | British West Indian |
| Minimum | 4.5% | 11.8% |
| Maximum | 65.3% | 63.7% |
| Range | 60.7% | 51.9% |
| Mean | 29.6% | 32.5% |
| Median | 28.9% | 32.0% |
| Interquartile 25% (IQ1) | 20.1% | 26.4% |
| Interquartile 75% (IQ3) | 38.2% | 38.0% |
| Interquartile Range (IQR) | 18.1% | 11.6% |
| Standard Deviation (Sample) | 13.8% | 9.8% |
| Standard Deviation (Population) | 13.7% | 9.7% |
Similar Demographics by Bachelor's Degree
Demographics Similar to Celtics by Bachelor's Degree
In terms of bachelor's degree, the demographic groups most similar to Celtics are Korean (37.0%, a difference of 0.030%), Belgian (37.0%, a difference of 0.040%), Czechoslovakian (37.0%, a difference of 0.040%), Welsh (37.0%, a difference of 0.050%), and Yugoslavian (37.1%, a difference of 0.23%).
| Demographics | Rating | Rank | Bachelor's Degree |
| Slovaks | 36.9 /100 | #189 | Fair 37.3% |
| Swiss | 34.1 /100 | #190 | Fair 37.2% |
| Nigerians | 33.9 /100 | #191 | Fair 37.2% |
| Immigrants | Vietnam | 32.1 /100 | #192 | Fair 37.1% |
| Yugoslavians | 31.5 /100 | #193 | Fair 37.1% |
| Belgians | 29.9 /100 | #194 | Fair 37.0% |
| Koreans | 29.8 /100 | #195 | Fair 37.0% |
| Celtics | 29.5 /100 | #196 | Fair 37.0% |
| Czechoslovakians | 29.2 /100 | #197 | Fair 37.0% |
| Welsh | 29.1 /100 | #198 | Fair 37.0% |
| Immigrants | Costa Rica | 27.4 /100 | #199 | Fair 36.9% |
| Immigrants | Ghana | 27.4 /100 | #200 | Fair 36.9% |
| Immigrants | South Eastern Asia | 25.4 /100 | #201 | Fair 36.8% |
| Immigrants | Zaire | 25.3 /100 | #202 | Fair 36.8% |
| Immigrants | Nigeria | 23.1 /100 | #203 | Fair 36.7% |
Demographics Similar to British West Indians by Bachelor's Degree
In terms of bachelor's degree, the demographic groups most similar to British West Indians are Guyanese (34.5%, a difference of 0.020%), Tlingit-Haida (34.6%, a difference of 0.30%), Liberian (34.6%, a difference of 0.34%), Immigrants from West Indies (34.6%, a difference of 0.45%), and Guamanian/Chamorro (34.6%, a difference of 0.54%).
| Demographics | Rating | Rank | Bachelor's Degree |
| Hmong | 3.4 /100 | #232 | Tragic 34.8% |
| Immigrants | Ecuador | 3.3 /100 | #233 | Tragic 34.7% |
| Guamanians/Chamorros | 3.0 /100 | #234 | Tragic 34.6% |
| Immigrants | West Indies | 2.9 /100 | #235 | Tragic 34.6% |
| Liberians | 2.8 /100 | #236 | Tragic 34.6% |
| Tlingit-Haida | 2.8 /100 | #237 | Tragic 34.6% |
| Guyanese | 2.5 /100 | #238 | Tragic 34.5% |
| British West Indians | 2.5 /100 | #239 | Tragic 34.5% |
| Tongans | 2.0 /100 | #240 | Tragic 34.3% |
| Immigrants | Cambodia | 1.9 /100 | #241 | Tragic 34.2% |
| Immigrants | Nonimmigrants | 1.8 /100 | #242 | Tragic 34.2% |
| Immigrants | Guyana | 1.4 /100 | #243 | Tragic 33.9% |
| Delaware | 1.2 /100 | #244 | Tragic 33.8% |
| Immigrants | Fiji | 1.2 /100 | #245 | Tragic 33.7% |
| Jamaicans | 1.0 /100 | #246 | Tragic 33.6% |