Cape Verdean vs Puerto Rican Female Poverty
COMPARE
Cape Verdean
Puerto Rican
Female Poverty
Female Poverty Comparison
Cape Verdeans
Puerto Ricans
15.6%
FEMALE POVERTY
0.1/ 100
METRIC RATING
259th/ 347
METRIC RANK
25.2%
FEMALE POVERTY
0.0/ 100
METRIC RATING
346th/ 347
METRIC RANK
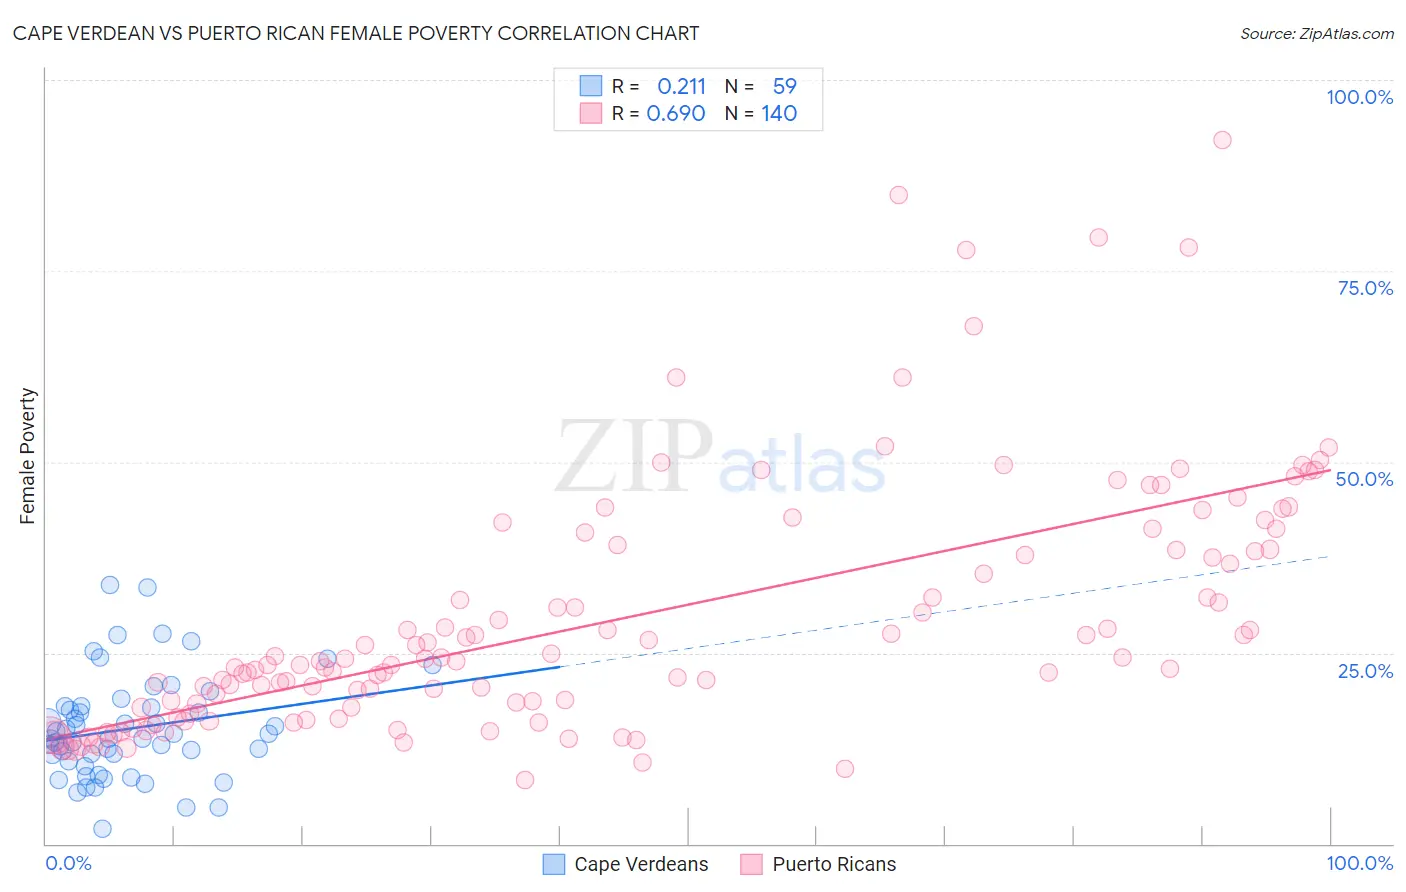
Cape Verdean vs Puerto Rican Female Poverty Correlation Chart
The statistical analysis conducted on geographies consisting of 107,541,318 people shows a weak positive correlation between the proportion of Cape Verdeans and poverty level among females in the United States with a correlation coefficient (R) of 0.211 and weighted average of 15.6%. Similarly, the statistical analysis conducted on geographies consisting of 527,465,024 people shows a significant positive correlation between the proportion of Puerto Ricans and poverty level among females in the United States with a correlation coefficient (R) of 0.690 and weighted average of 25.2%, a difference of 61.6%.
Female Poverty Correlation Summary
| Measurement | Cape Verdean | Puerto Rican |
| Minimum | 2.0% | 8.4% |
| Maximum | 33.8% | 92.2% |
| Range | 31.8% | 83.8% |
| Mean | 15.1% | 29.3% |
| Median | 13.8% | 23.9% |
| Interquartile 25% (IQ1) | 10.8% | 17.8% |
| Interquartile 75% (IQ3) | 18.0% | 38.5% |
| Interquartile Range (IQR) | 7.2% | 20.6% |
| Standard Deviation (Sample) | 6.7% | 16.3% |
| Standard Deviation (Population) | 6.7% | 16.2% |
Similar Demographics by Female Poverty
Demographics Similar to Cape Verdeans by Female Poverty
In terms of female poverty, the demographic groups most similar to Cape Verdeans are Immigrants from Guyana (15.6%, a difference of 0.080%), Shoshone (15.6%, a difference of 0.12%), Immigrants from Jamaica (15.6%, a difference of 0.18%), Guyanese (15.6%, a difference of 0.18%), and Mexican American Indian (15.6%, a difference of 0.18%).
| Demographics | Rating | Rank | Female Poverty |
| Immigrants | Burma/Myanmar | 0.3 /100 | #252 | Tragic 15.4% |
| Liberians | 0.2 /100 | #253 | Tragic 15.4% |
| Trinidadians and Tobagonians | 0.2 /100 | #254 | Tragic 15.4% |
| Ottawa | 0.2 /100 | #255 | Tragic 15.5% |
| Jamaicans | 0.2 /100 | #256 | Tragic 15.5% |
| Immigrants | Jamaica | 0.1 /100 | #257 | Tragic 15.6% |
| Shoshone | 0.1 /100 | #258 | Tragic 15.6% |
| Cape Verdeans | 0.1 /100 | #259 | Tragic 15.6% |
| Immigrants | Guyana | 0.1 /100 | #260 | Tragic 15.6% |
| Guyanese | 0.1 /100 | #261 | Tragic 15.6% |
| Mexican American Indians | 0.1 /100 | #262 | Tragic 15.6% |
| Cherokee | 0.1 /100 | #263 | Tragic 15.6% |
| Immigrants | Ecuador | 0.1 /100 | #264 | Tragic 15.6% |
| Immigrants | Liberia | 0.1 /100 | #265 | Tragic 15.7% |
| Immigrants | El Salvador | 0.1 /100 | #266 | Tragic 15.7% |
Demographics Similar to Puerto Ricans by Female Poverty
In terms of female poverty, the demographic groups most similar to Puerto Ricans are Tohono O'odham (25.9%, a difference of 3.0%), Navajo (23.9%, a difference of 5.4%), Pima (23.6%, a difference of 6.8%), Lumbee (23.5%, a difference of 7.1%), and Immigrants from Yemen (22.8%, a difference of 10.3%).
| Demographics | Rating | Rank | Female Poverty |
| Immigrants | Dominican Republic | 0.0 /100 | #333 | Tragic 19.3% |
| Houma | 0.0 /100 | #334 | Tragic 20.0% |
| Cheyenne | 0.0 /100 | #335 | Tragic 20.2% |
| Pueblo | 0.0 /100 | #336 | Tragic 20.7% |
| Yuman | 0.0 /100 | #337 | Tragic 20.8% |
| Sioux | 0.0 /100 | #338 | Tragic 20.9% |
| Hopi | 0.0 /100 | #339 | Tragic 21.0% |
| Yup'ik | 0.0 /100 | #340 | Tragic 21.5% |
| Crow | 0.0 /100 | #341 | Tragic 22.1% |
| Immigrants | Yemen | 0.0 /100 | #342 | Tragic 22.8% |
| Lumbee | 0.0 /100 | #343 | Tragic 23.5% |
| Pima | 0.0 /100 | #344 | Tragic 23.6% |
| Navajo | 0.0 /100 | #345 | Tragic 23.9% |
| Puerto Ricans | 0.0 /100 | #346 | Tragic 25.2% |
| Tohono O'odham | 0.0 /100 | #347 | Tragic 25.9% |