Cape Verdean vs Seminole Female Poverty
COMPARE
Cape Verdean
Seminole
Female Poverty
Female Poverty Comparison
Cape Verdeans
Seminole
15.6%
FEMALE POVERTY
0.1/ 100
METRIC RATING
259th/ 347
METRIC RANK
16.9%
FEMALE POVERTY
0.0/ 100
METRIC RATING
307th/ 347
METRIC RANK
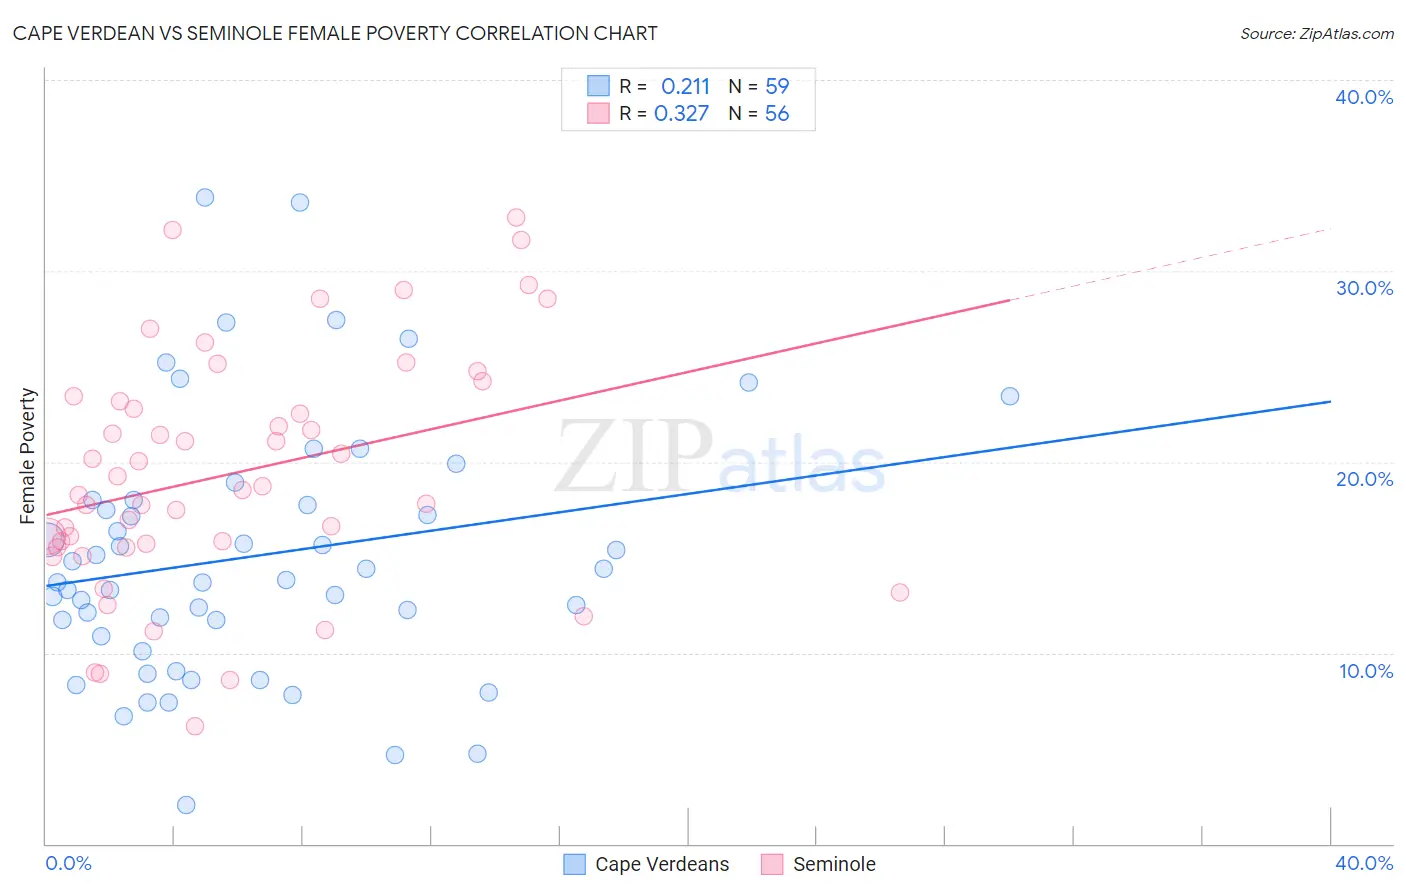
Cape Verdean vs Seminole Female Poverty Correlation Chart
The statistical analysis conducted on geographies consisting of 107,541,318 people shows a weak positive correlation between the proportion of Cape Verdeans and poverty level among females in the United States with a correlation coefficient (R) of 0.211 and weighted average of 15.6%. Similarly, the statistical analysis conducted on geographies consisting of 118,292,292 people shows a mild positive correlation between the proportion of Seminole and poverty level among females in the United States with a correlation coefficient (R) of 0.327 and weighted average of 16.9%, a difference of 8.4%.
Female Poverty Correlation Summary
| Measurement | Cape Verdean | Seminole |
| Minimum | 2.0% | 6.2% |
| Maximum | 33.8% | 32.8% |
| Range | 31.8% | 26.6% |
| Mean | 15.1% | 19.4% |
| Median | 13.8% | 18.6% |
| Interquartile 25% (IQ1) | 10.8% | 15.6% |
| Interquartile 75% (IQ3) | 18.0% | 23.3% |
| Interquartile Range (IQR) | 7.2% | 7.7% |
| Standard Deviation (Sample) | 6.7% | 6.2% |
| Standard Deviation (Population) | 6.7% | 6.2% |
Similar Demographics by Female Poverty
Demographics Similar to Cape Verdeans by Female Poverty
In terms of female poverty, the demographic groups most similar to Cape Verdeans are Immigrants from Guyana (15.6%, a difference of 0.080%), Shoshone (15.6%, a difference of 0.12%), Immigrants from Jamaica (15.6%, a difference of 0.18%), Guyanese (15.6%, a difference of 0.18%), and Mexican American Indian (15.6%, a difference of 0.18%).
| Demographics | Rating | Rank | Female Poverty |
| Immigrants | Burma/Myanmar | 0.3 /100 | #252 | Tragic 15.4% |
| Liberians | 0.2 /100 | #253 | Tragic 15.4% |
| Trinidadians and Tobagonians | 0.2 /100 | #254 | Tragic 15.4% |
| Ottawa | 0.2 /100 | #255 | Tragic 15.5% |
| Jamaicans | 0.2 /100 | #256 | Tragic 15.5% |
| Immigrants | Jamaica | 0.1 /100 | #257 | Tragic 15.6% |
| Shoshone | 0.1 /100 | #258 | Tragic 15.6% |
| Cape Verdeans | 0.1 /100 | #259 | Tragic 15.6% |
| Immigrants | Guyana | 0.1 /100 | #260 | Tragic 15.6% |
| Guyanese | 0.1 /100 | #261 | Tragic 15.6% |
| Mexican American Indians | 0.1 /100 | #262 | Tragic 15.6% |
| Cherokee | 0.1 /100 | #263 | Tragic 15.6% |
| Immigrants | Ecuador | 0.1 /100 | #264 | Tragic 15.6% |
| Immigrants | Liberia | 0.1 /100 | #265 | Tragic 15.7% |
| Immigrants | El Salvador | 0.1 /100 | #266 | Tragic 15.7% |
Demographics Similar to Seminole by Female Poverty
In terms of female poverty, the demographic groups most similar to Seminole are African (16.9%, a difference of 0.060%), Immigrants from Caribbean (16.9%, a difference of 0.12%), Immigrants from Grenada (16.8%, a difference of 0.39%), Immigrants from Central America (16.8%, a difference of 0.40%), and Immigrants from Mexico (17.0%, a difference of 0.45%).
| Demographics | Rating | Rank | Female Poverty |
| Bahamians | 0.0 /100 | #300 | Tragic 16.6% |
| Guatemalans | 0.0 /100 | #301 | Tragic 16.7% |
| Chippewa | 0.0 /100 | #302 | Tragic 16.7% |
| Choctaw | 0.0 /100 | #303 | Tragic 16.8% |
| Immigrants | Central America | 0.0 /100 | #304 | Tragic 16.8% |
| Immigrants | Grenada | 0.0 /100 | #305 | Tragic 16.8% |
| Immigrants | Caribbean | 0.0 /100 | #306 | Tragic 16.9% |
| Seminole | 0.0 /100 | #307 | Tragic 16.9% |
| Africans | 0.0 /100 | #308 | Tragic 16.9% |
| Immigrants | Mexico | 0.0 /100 | #309 | Tragic 17.0% |
| Creek | 0.0 /100 | #310 | Tragic 17.0% |
| Immigrants | Guatemala | 0.0 /100 | #311 | Tragic 17.0% |
| Immigrants | Somalia | 0.0 /100 | #312 | Tragic 17.0% |
| British West Indians | 0.0 /100 | #313 | Tragic 17.0% |
| Dutch West Indians | 0.0 /100 | #314 | Tragic 17.1% |