Lebanese vs Puerto Rican Female Poverty
COMPARE
Lebanese
Puerto Rican
Female Poverty
Female Poverty Comparison
Lebanese
Puerto Ricans
13.4%
FEMALE POVERTY
55.9/ 100
METRIC RATING
169th/ 347
METRIC RANK
25.2%
FEMALE POVERTY
0.0/ 100
METRIC RATING
346th/ 347
METRIC RANK
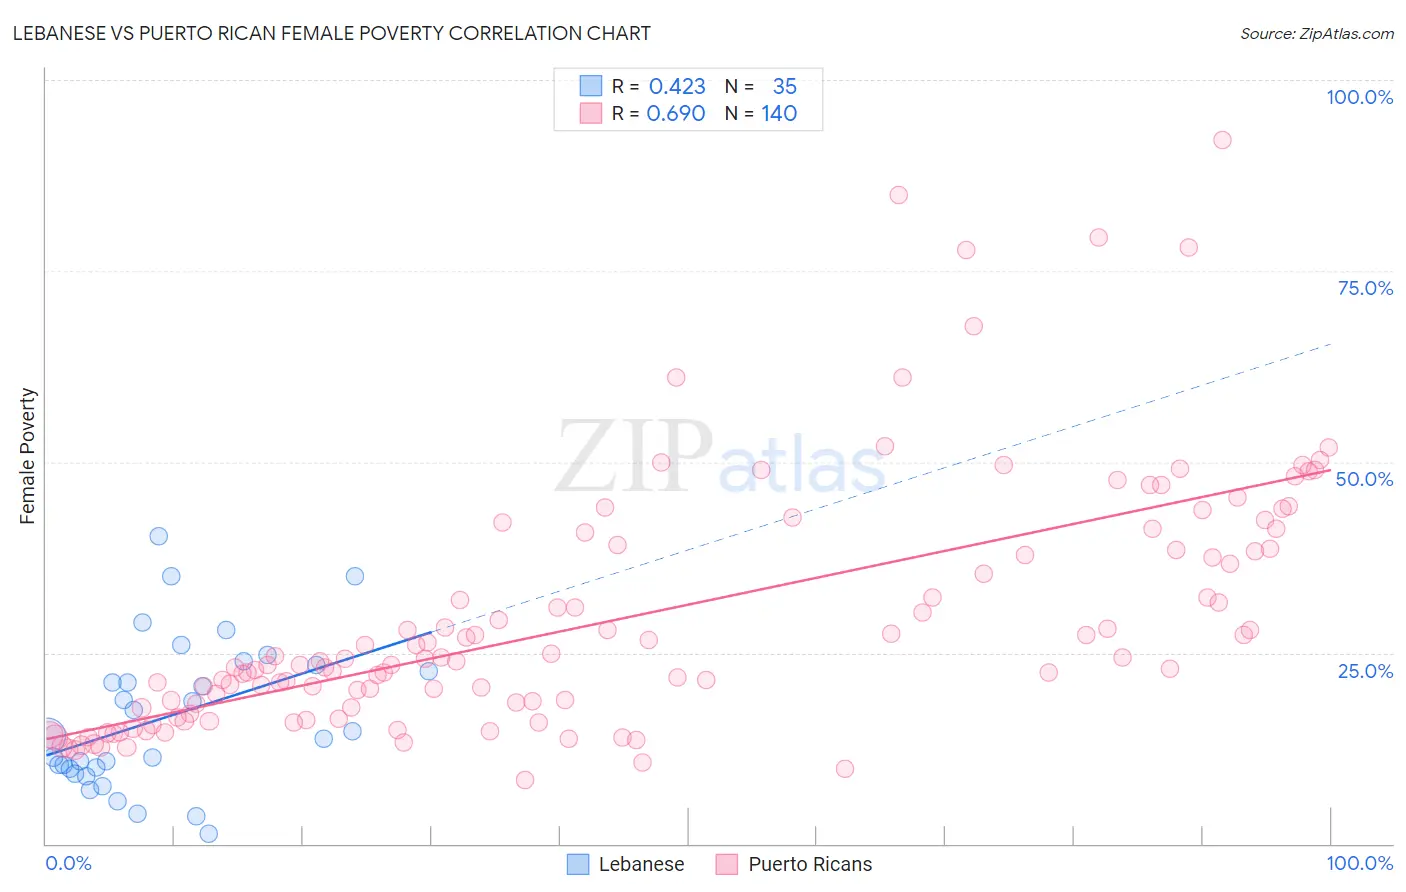
Lebanese vs Puerto Rican Female Poverty Correlation Chart
The statistical analysis conducted on geographies consisting of 401,241,772 people shows a moderate positive correlation between the proportion of Lebanese and poverty level among females in the United States with a correlation coefficient (R) of 0.423 and weighted average of 13.4%. Similarly, the statistical analysis conducted on geographies consisting of 527,465,024 people shows a significant positive correlation between the proportion of Puerto Ricans and poverty level among females in the United States with a correlation coefficient (R) of 0.690 and weighted average of 25.2%, a difference of 88.4%.
Female Poverty Correlation Summary
| Measurement | Lebanese | Puerto Rican |
| Minimum | 1.3% | 8.4% |
| Maximum | 40.3% | 92.2% |
| Range | 38.9% | 83.8% |
| Mean | 16.6% | 29.3% |
| Median | 14.0% | 23.9% |
| Interquartile 25% (IQ1) | 9.8% | 17.8% |
| Interquartile 75% (IQ3) | 23.4% | 38.5% |
| Interquartile Range (IQR) | 13.6% | 20.6% |
| Standard Deviation (Sample) | 9.6% | 16.3% |
| Standard Deviation (Population) | 9.5% | 16.2% |
Similar Demographics by Female Poverty
Demographics Similar to Lebanese by Female Poverty
In terms of female poverty, the demographic groups most similar to Lebanese are Colombian (13.4%, a difference of 0.020%), Aleut (13.4%, a difference of 0.080%), White/Caucasian (13.4%, a difference of 0.13%), Immigrants from Chile (13.3%, a difference of 0.14%), and Mongolian (13.4%, a difference of 0.23%).
| Demographics | Rating | Rank | Female Poverty |
| Guamanians/Chamorros | 62.4 /100 | #162 | Good 13.3% |
| Immigrants | Albania | 62.4 /100 | #163 | Good 13.3% |
| Ethiopians | 62.3 /100 | #164 | Good 13.3% |
| Scotch-Irish | 62.1 /100 | #165 | Good 13.3% |
| Immigrants | Oceania | 59.7 /100 | #166 | Average 13.3% |
| Immigrants | Chile | 57.4 /100 | #167 | Average 13.3% |
| Aleuts | 56.7 /100 | #168 | Average 13.4% |
| Lebanese | 55.9 /100 | #169 | Average 13.4% |
| Colombians | 55.7 /100 | #170 | Average 13.4% |
| Whites/Caucasians | 54.6 /100 | #171 | Average 13.4% |
| Mongolians | 53.6 /100 | #172 | Average 13.4% |
| Immigrants | Afghanistan | 50.8 /100 | #173 | Average 13.4% |
| Immigrants | Iraq | 50.0 /100 | #174 | Average 13.4% |
| Celtics | 49.9 /100 | #175 | Average 13.4% |
| Immigrants | Spain | 49.9 /100 | #176 | Average 13.4% |
Demographics Similar to Puerto Ricans by Female Poverty
In terms of female poverty, the demographic groups most similar to Puerto Ricans are Tohono O'odham (25.9%, a difference of 3.0%), Navajo (23.9%, a difference of 5.4%), Pima (23.6%, a difference of 6.8%), Lumbee (23.5%, a difference of 7.1%), and Immigrants from Yemen (22.8%, a difference of 10.3%).
| Demographics | Rating | Rank | Female Poverty |
| Immigrants | Dominican Republic | 0.0 /100 | #333 | Tragic 19.3% |
| Houma | 0.0 /100 | #334 | Tragic 20.0% |
| Cheyenne | 0.0 /100 | #335 | Tragic 20.2% |
| Pueblo | 0.0 /100 | #336 | Tragic 20.7% |
| Yuman | 0.0 /100 | #337 | Tragic 20.8% |
| Sioux | 0.0 /100 | #338 | Tragic 20.9% |
| Hopi | 0.0 /100 | #339 | Tragic 21.0% |
| Yup'ik | 0.0 /100 | #340 | Tragic 21.5% |
| Crow | 0.0 /100 | #341 | Tragic 22.1% |
| Immigrants | Yemen | 0.0 /100 | #342 | Tragic 22.8% |
| Lumbee | 0.0 /100 | #343 | Tragic 23.5% |
| Pima | 0.0 /100 | #344 | Tragic 23.6% |
| Navajo | 0.0 /100 | #345 | Tragic 23.9% |
| Puerto Ricans | 0.0 /100 | #346 | Tragic 25.2% |
| Tohono O'odham | 0.0 /100 | #347 | Tragic 25.9% |