Immigrants from Denmark vs Puerto Rican Female Poverty
COMPARE
Immigrants from Denmark
Puerto Rican
Female Poverty
Female Poverty Comparison
Immigrants from Denmark
Puerto Ricans
12.4%
FEMALE POVERTY
95.8/ 100
METRIC RATING
90th/ 347
METRIC RANK
25.2%
FEMALE POVERTY
0.0/ 100
METRIC RATING
346th/ 347
METRIC RANK
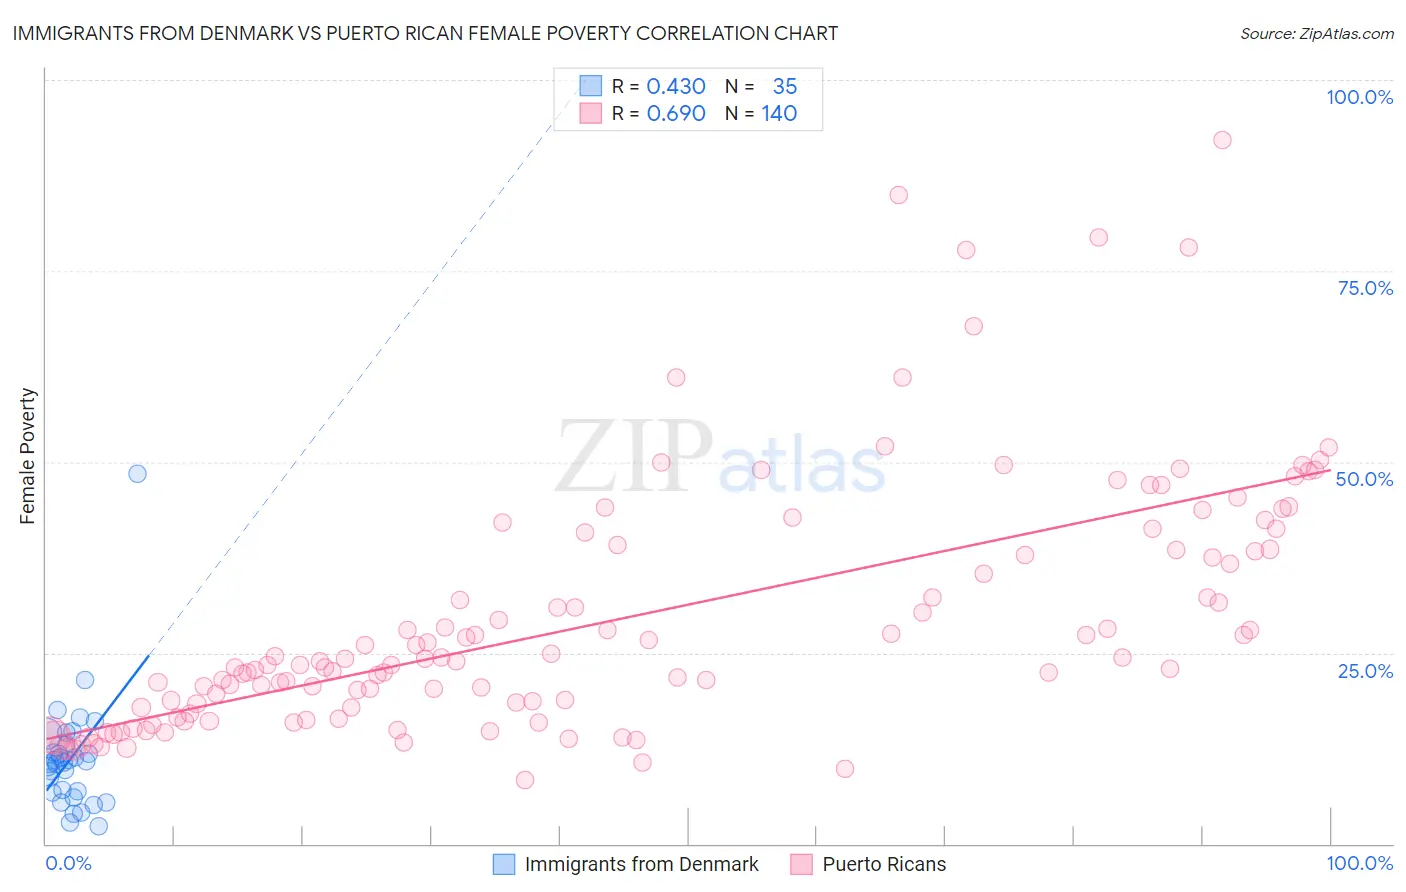
Immigrants from Denmark vs Puerto Rican Female Poverty Correlation Chart
The statistical analysis conducted on geographies consisting of 136,395,375 people shows a moderate positive correlation between the proportion of Immigrants from Denmark and poverty level among females in the United States with a correlation coefficient (R) of 0.430 and weighted average of 12.4%. Similarly, the statistical analysis conducted on geographies consisting of 527,465,024 people shows a significant positive correlation between the proportion of Puerto Ricans and poverty level among females in the United States with a correlation coefficient (R) of 0.690 and weighted average of 25.2%, a difference of 102.6%.
Female Poverty Correlation Summary
| Measurement | Immigrants from Denmark | Puerto Rican |
| Minimum | 2.3% | 8.4% |
| Maximum | 48.4% | 92.2% |
| Range | 46.1% | 83.8% |
| Mean | 11.2% | 29.3% |
| Median | 10.7% | 23.9% |
| Interquartile 25% (IQ1) | 6.7% | 17.8% |
| Interquartile 75% (IQ3) | 12.9% | 38.5% |
| Interquartile Range (IQR) | 6.1% | 20.6% |
| Standard Deviation (Sample) | 7.8% | 16.3% |
| Standard Deviation (Population) | 7.7% | 16.2% |
Similar Demographics by Female Poverty
Demographics Similar to Immigrants from Denmark by Female Poverty
In terms of female poverty, the demographic groups most similar to Immigrants from Denmark are Belgian (12.4%, a difference of 0.010%), Czechoslovakian (12.4%, a difference of 0.020%), Immigrants from Egypt (12.5%, a difference of 0.20%), English (12.4%, a difference of 0.22%), and Immigrants from Indonesia (12.5%, a difference of 0.22%).
| Demographics | Rating | Rank | Female Poverty |
| Immigrants | England | 96.9 /100 | #83 | Exceptional 12.3% |
| Northern Europeans | 96.6 /100 | #84 | Exceptional 12.4% |
| Irish | 96.5 /100 | #85 | Exceptional 12.4% |
| Dutch | 96.5 /100 | #86 | Exceptional 12.4% |
| Okinawans | 96.4 /100 | #87 | Exceptional 12.4% |
| Finns | 96.4 /100 | #88 | Exceptional 12.4% |
| English | 96.1 /100 | #89 | Exceptional 12.4% |
| Immigrants | Denmark | 95.8 /100 | #90 | Exceptional 12.4% |
| Belgians | 95.8 /100 | #91 | Exceptional 12.4% |
| Czechoslovakians | 95.7 /100 | #92 | Exceptional 12.4% |
| Immigrants | Egypt | 95.5 /100 | #93 | Exceptional 12.5% |
| Immigrants | Indonesia | 95.4 /100 | #94 | Exceptional 12.5% |
| Immigrants | South Africa | 95.4 /100 | #95 | Exceptional 12.5% |
| British | 95.2 /100 | #96 | Exceptional 12.5% |
| Australians | 95.2 /100 | #97 | Exceptional 12.5% |
Demographics Similar to Puerto Ricans by Female Poverty
In terms of female poverty, the demographic groups most similar to Puerto Ricans are Tohono O'odham (25.9%, a difference of 3.0%), Navajo (23.9%, a difference of 5.4%), Pima (23.6%, a difference of 6.8%), Lumbee (23.5%, a difference of 7.1%), and Immigrants from Yemen (22.8%, a difference of 10.3%).
| Demographics | Rating | Rank | Female Poverty |
| Immigrants | Dominican Republic | 0.0 /100 | #333 | Tragic 19.3% |
| Houma | 0.0 /100 | #334 | Tragic 20.0% |
| Cheyenne | 0.0 /100 | #335 | Tragic 20.2% |
| Pueblo | 0.0 /100 | #336 | Tragic 20.7% |
| Yuman | 0.0 /100 | #337 | Tragic 20.8% |
| Sioux | 0.0 /100 | #338 | Tragic 20.9% |
| Hopi | 0.0 /100 | #339 | Tragic 21.0% |
| Yup'ik | 0.0 /100 | #340 | Tragic 21.5% |
| Crow | 0.0 /100 | #341 | Tragic 22.1% |
| Immigrants | Yemen | 0.0 /100 | #342 | Tragic 22.8% |
| Lumbee | 0.0 /100 | #343 | Tragic 23.5% |
| Pima | 0.0 /100 | #344 | Tragic 23.6% |
| Navajo | 0.0 /100 | #345 | Tragic 23.9% |
| Puerto Ricans | 0.0 /100 | #346 | Tragic 25.2% |
| Tohono O'odham | 0.0 /100 | #347 | Tragic 25.9% |