Immigrants from Barbados vs Puerto Rican Female Poverty
COMPARE
Immigrants from Barbados
Puerto Rican
Female Poverty
Female Poverty Comparison
Immigrants from Barbados
Puerto Ricans
16.0%
FEMALE POVERTY
0.0/ 100
METRIC RATING
275th/ 347
METRIC RANK
25.2%
FEMALE POVERTY
0.0/ 100
METRIC RATING
346th/ 347
METRIC RANK
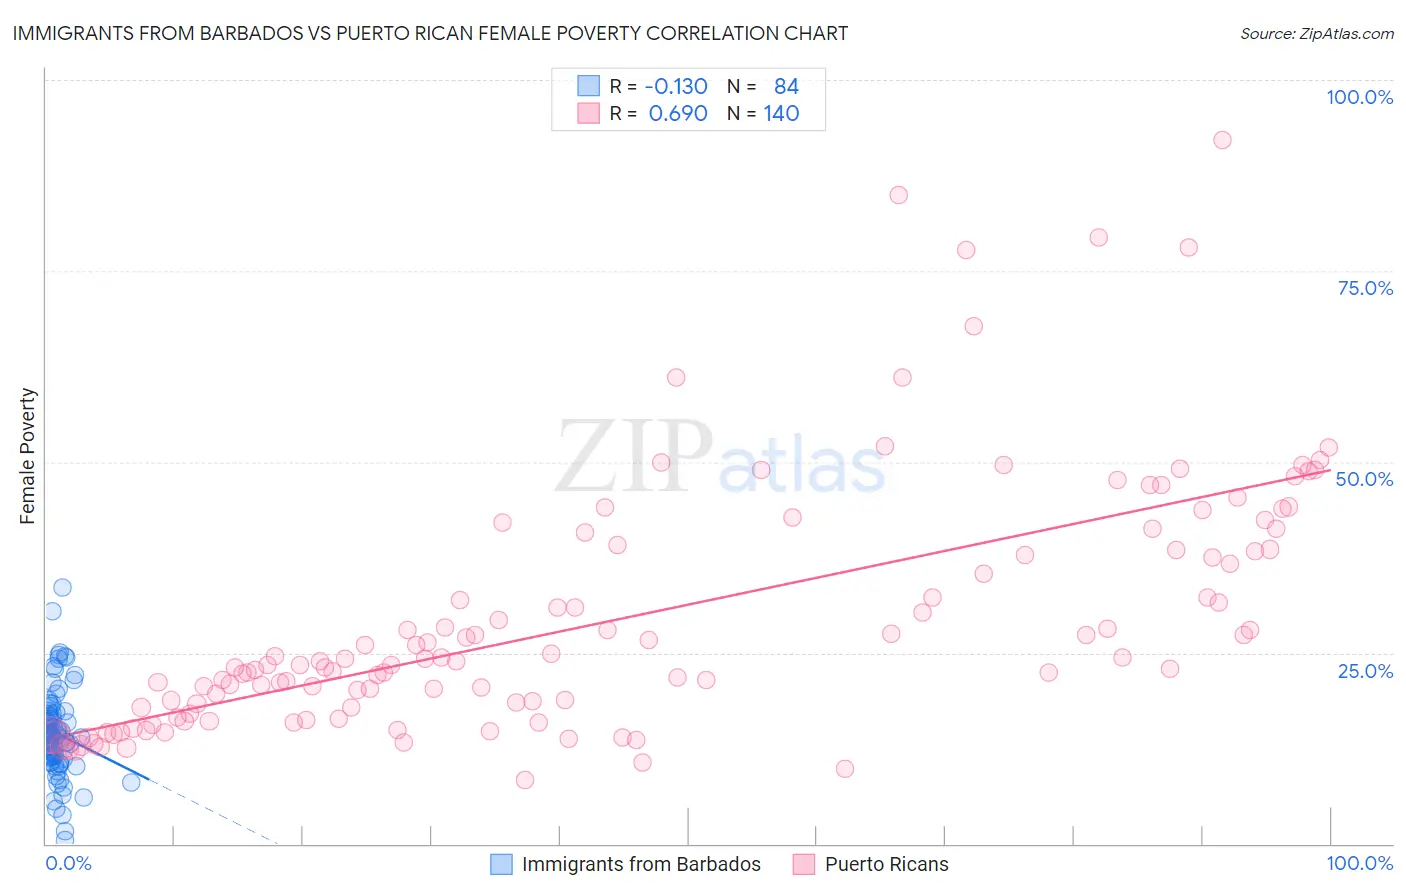
Immigrants from Barbados vs Puerto Rican Female Poverty Correlation Chart
The statistical analysis conducted on geographies consisting of 112,761,871 people shows a poor negative correlation between the proportion of Immigrants from Barbados and poverty level among females in the United States with a correlation coefficient (R) of -0.130 and weighted average of 16.0%. Similarly, the statistical analysis conducted on geographies consisting of 527,465,024 people shows a significant positive correlation between the proportion of Puerto Ricans and poverty level among females in the United States with a correlation coefficient (R) of 0.690 and weighted average of 25.2%, a difference of 57.8%.
Female Poverty Correlation Summary
| Measurement | Immigrants from Barbados | Puerto Rican |
| Minimum | 0.50% | 8.4% |
| Maximum | 33.6% | 92.2% |
| Range | 33.1% | 83.8% |
| Mean | 14.4% | 29.3% |
| Median | 14.1% | 23.9% |
| Interquartile 25% (IQ1) | 11.2% | 17.8% |
| Interquartile 75% (IQ3) | 17.1% | 38.5% |
| Interquartile Range (IQR) | 5.8% | 20.6% |
| Standard Deviation (Sample) | 5.9% | 16.3% |
| Standard Deviation (Population) | 5.8% | 16.2% |
Similar Demographics by Female Poverty
Demographics Similar to Immigrants from Barbados by Female Poverty
In terms of female poverty, the demographic groups most similar to Immigrants from Barbados are Belizean (15.9%, a difference of 0.070%), Haitian (15.9%, a difference of 0.070%), Barbadian (15.9%, a difference of 0.070%), Central American (16.0%, a difference of 0.13%), and Immigrants from St. Vincent and the Grenadines (15.9%, a difference of 0.30%).
| Demographics | Rating | Rank | Female Poverty |
| Immigrants | Nicaragua | 0.1 /100 | #268 | Tragic 15.8% |
| Iroquois | 0.1 /100 | #269 | Tragic 15.8% |
| Chickasaw | 0.1 /100 | #270 | Tragic 15.9% |
| Immigrants | St. Vincent and the Grenadines | 0.0 /100 | #271 | Tragic 15.9% |
| Belizeans | 0.0 /100 | #272 | Tragic 15.9% |
| Haitians | 0.0 /100 | #273 | Tragic 15.9% |
| Barbadians | 0.0 /100 | #274 | Tragic 15.9% |
| Immigrants | Barbados | 0.0 /100 | #275 | Tragic 16.0% |
| Central Americans | 0.0 /100 | #276 | Tragic 16.0% |
| Bangladeshis | 0.0 /100 | #277 | Tragic 16.0% |
| Immigrants | West Indies | 0.0 /100 | #278 | Tragic 16.1% |
| Immigrants | Bahamas | 0.0 /100 | #279 | Tragic 16.1% |
| Vietnamese | 0.0 /100 | #280 | Tragic 16.1% |
| West Indians | 0.0 /100 | #281 | Tragic 16.1% |
| Immigrants | Haiti | 0.0 /100 | #282 | Tragic 16.1% |
Demographics Similar to Puerto Ricans by Female Poverty
In terms of female poverty, the demographic groups most similar to Puerto Ricans are Tohono O'odham (25.9%, a difference of 3.0%), Navajo (23.9%, a difference of 5.4%), Pima (23.6%, a difference of 6.8%), Lumbee (23.5%, a difference of 7.1%), and Immigrants from Yemen (22.8%, a difference of 10.3%).
| Demographics | Rating | Rank | Female Poverty |
| Immigrants | Dominican Republic | 0.0 /100 | #333 | Tragic 19.3% |
| Houma | 0.0 /100 | #334 | Tragic 20.0% |
| Cheyenne | 0.0 /100 | #335 | Tragic 20.2% |
| Pueblo | 0.0 /100 | #336 | Tragic 20.7% |
| Yuman | 0.0 /100 | #337 | Tragic 20.8% |
| Sioux | 0.0 /100 | #338 | Tragic 20.9% |
| Hopi | 0.0 /100 | #339 | Tragic 21.0% |
| Yup'ik | 0.0 /100 | #340 | Tragic 21.5% |
| Crow | 0.0 /100 | #341 | Tragic 22.1% |
| Immigrants | Yemen | 0.0 /100 | #342 | Tragic 22.8% |
| Lumbee | 0.0 /100 | #343 | Tragic 23.5% |
| Pima | 0.0 /100 | #344 | Tragic 23.6% |
| Navajo | 0.0 /100 | #345 | Tragic 23.9% |
| Puerto Ricans | 0.0 /100 | #346 | Tragic 25.2% |
| Tohono O'odham | 0.0 /100 | #347 | Tragic 25.9% |