Cape Verdean vs Immigrants from Ethiopia Female Poverty
COMPARE
Cape Verdean
Immigrants from Ethiopia
Female Poverty
Female Poverty Comparison
Cape Verdeans
Immigrants from Ethiopia
15.6%
FEMALE POVERTY
0.1/ 100
METRIC RATING
259th/ 347
METRIC RANK
13.3%
FEMALE POVERTY
62.5/ 100
METRIC RATING
161st/ 347
METRIC RANK
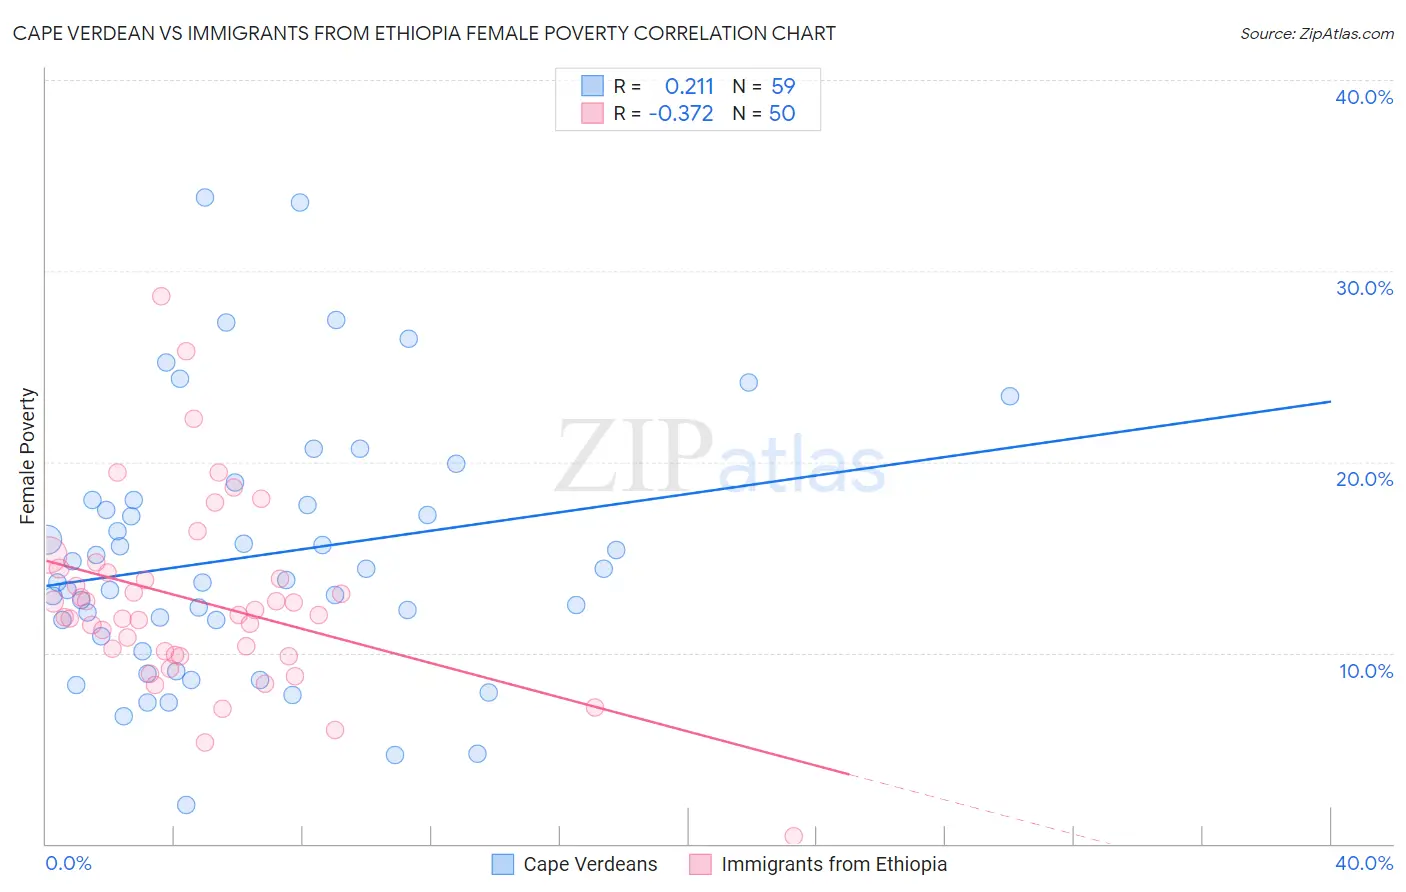
Cape Verdean vs Immigrants from Ethiopia Female Poverty Correlation Chart
The statistical analysis conducted on geographies consisting of 107,541,318 people shows a weak positive correlation between the proportion of Cape Verdeans and poverty level among females in the United States with a correlation coefficient (R) of 0.211 and weighted average of 15.6%. Similarly, the statistical analysis conducted on geographies consisting of 211,427,583 people shows a mild negative correlation between the proportion of Immigrants from Ethiopia and poverty level among females in the United States with a correlation coefficient (R) of -0.372 and weighted average of 13.3%, a difference of 17.4%.
Female Poverty Correlation Summary
| Measurement | Cape Verdean | Immigrants from Ethiopia |
| Minimum | 2.0% | 0.38% |
| Maximum | 33.8% | 28.7% |
| Range | 31.8% | 28.3% |
| Mean | 15.1% | 12.7% |
| Median | 13.8% | 12.0% |
| Interquartile 25% (IQ1) | 10.8% | 9.9% |
| Interquartile 75% (IQ3) | 18.0% | 14.2% |
| Interquartile Range (IQR) | 7.2% | 4.4% |
| Standard Deviation (Sample) | 6.7% | 4.9% |
| Standard Deviation (Population) | 6.7% | 4.9% |
Similar Demographics by Female Poverty
Demographics Similar to Cape Verdeans by Female Poverty
In terms of female poverty, the demographic groups most similar to Cape Verdeans are Immigrants from Guyana (15.6%, a difference of 0.080%), Shoshone (15.6%, a difference of 0.12%), Immigrants from Jamaica (15.6%, a difference of 0.18%), Guyanese (15.6%, a difference of 0.18%), and Mexican American Indian (15.6%, a difference of 0.18%).
| Demographics | Rating | Rank | Female Poverty |
| Immigrants | Burma/Myanmar | 0.3 /100 | #252 | Tragic 15.4% |
| Liberians | 0.2 /100 | #253 | Tragic 15.4% |
| Trinidadians and Tobagonians | 0.2 /100 | #254 | Tragic 15.4% |
| Ottawa | 0.2 /100 | #255 | Tragic 15.5% |
| Jamaicans | 0.2 /100 | #256 | Tragic 15.5% |
| Immigrants | Jamaica | 0.1 /100 | #257 | Tragic 15.6% |
| Shoshone | 0.1 /100 | #258 | Tragic 15.6% |
| Cape Verdeans | 0.1 /100 | #259 | Tragic 15.6% |
| Immigrants | Guyana | 0.1 /100 | #260 | Tragic 15.6% |
| Guyanese | 0.1 /100 | #261 | Tragic 15.6% |
| Mexican American Indians | 0.1 /100 | #262 | Tragic 15.6% |
| Cherokee | 0.1 /100 | #263 | Tragic 15.6% |
| Immigrants | Ecuador | 0.1 /100 | #264 | Tragic 15.6% |
| Immigrants | Liberia | 0.1 /100 | #265 | Tragic 15.7% |
| Immigrants | El Salvador | 0.1 /100 | #266 | Tragic 15.7% |
Demographics Similar to Immigrants from Ethiopia by Female Poverty
In terms of female poverty, the demographic groups most similar to Immigrants from Ethiopia are Guamanian/Chamorro (13.3%, a difference of 0.010%), Immigrants from Albania (13.3%, a difference of 0.010%), Ethiopian (13.3%, a difference of 0.020%), Immigrants from Nepal (13.3%, a difference of 0.030%), and Scotch-Irish (13.3%, a difference of 0.040%).
| Demographics | Rating | Rank | Female Poverty |
| Armenians | 70.4 /100 | #154 | Good 13.2% |
| Hungarians | 70.1 /100 | #155 | Good 13.2% |
| Immigrants | Bosnia and Herzegovina | 69.7 /100 | #156 | Good 13.2% |
| Immigrants | Northern Africa | 68.8 /100 | #157 | Good 13.2% |
| Pennsylvania Germans | 67.3 /100 | #158 | Good 13.2% |
| Costa Ricans | 63.6 /100 | #159 | Good 13.3% |
| Immigrants | Nepal | 62.7 /100 | #160 | Good 13.3% |
| Immigrants | Ethiopia | 62.5 /100 | #161 | Good 13.3% |
| Guamanians/Chamorros | 62.4 /100 | #162 | Good 13.3% |
| Immigrants | Albania | 62.4 /100 | #163 | Good 13.3% |
| Ethiopians | 62.3 /100 | #164 | Good 13.3% |
| Scotch-Irish | 62.1 /100 | #165 | Good 13.3% |
| Immigrants | Oceania | 59.7 /100 | #166 | Average 13.3% |
| Immigrants | Chile | 57.4 /100 | #167 | Average 13.3% |
| Aleuts | 56.7 /100 | #168 | Average 13.4% |