Cape Verdean vs Apache Male Poverty
COMPARE
Cape Verdean
Apache
Male Poverty
Male Poverty Comparison
Cape Verdeans
Apache
13.1%
MALE POVERTY
0.1/ 100
METRIC RATING
258th/ 347
METRIC RANK
17.7%
MALE POVERTY
0.0/ 100
METRIC RATING
335th/ 347
METRIC RANK
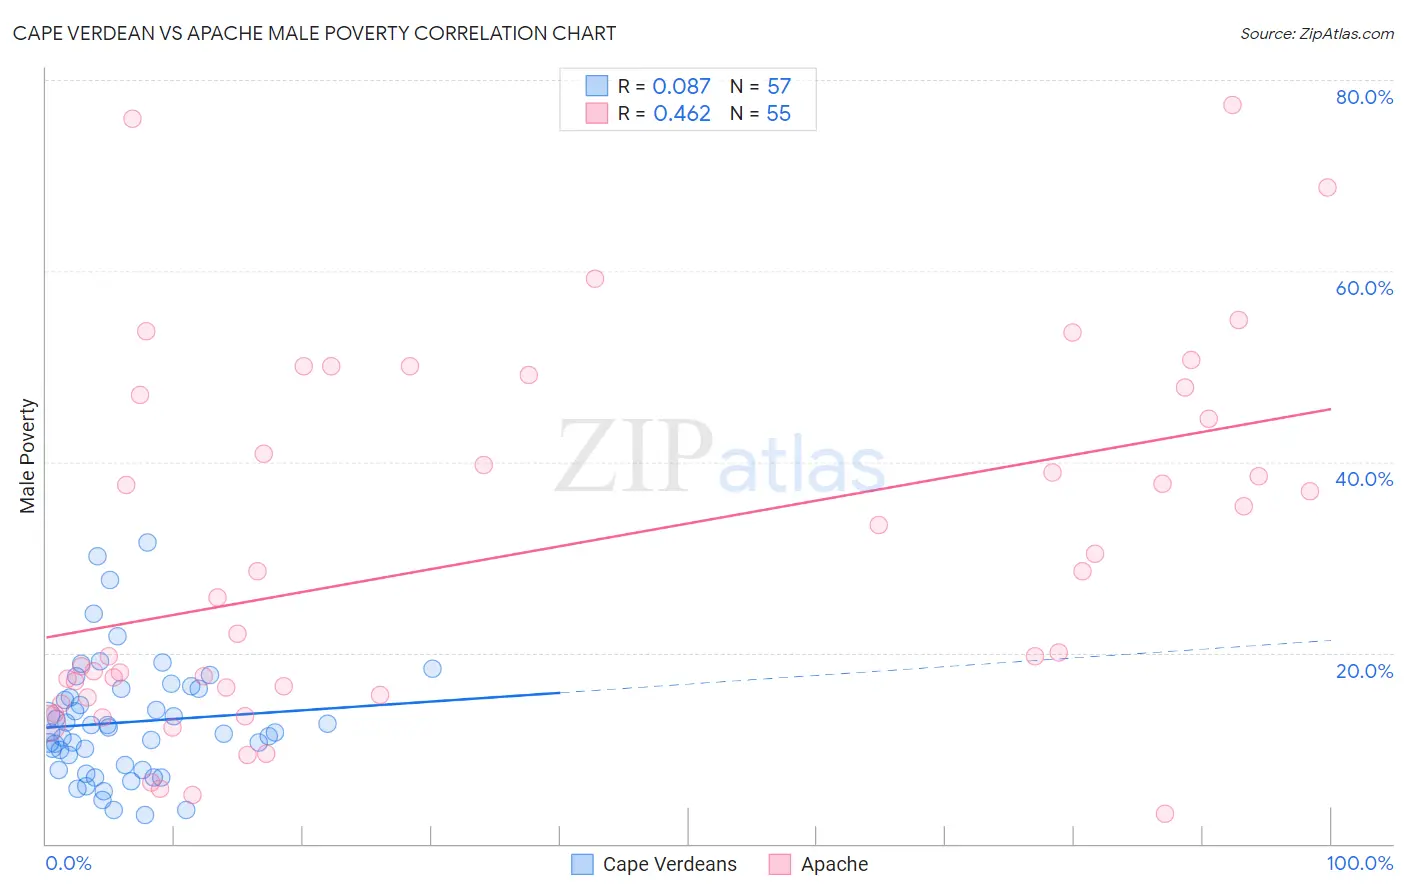
Cape Verdean vs Apache Male Poverty Correlation Chart
The statistical analysis conducted on geographies consisting of 107,527,352 people shows a slight positive correlation between the proportion of Cape Verdeans and poverty level among males in the United States with a correlation coefficient (R) of 0.087 and weighted average of 13.1%. Similarly, the statistical analysis conducted on geographies consisting of 231,014,108 people shows a moderate positive correlation between the proportion of Apache and poverty level among males in the United States with a correlation coefficient (R) of 0.462 and weighted average of 17.7%, a difference of 35.2%.
Male Poverty Correlation Summary
| Measurement | Cape Verdean | Apache |
| Minimum | 3.0% | 3.1% |
| Maximum | 31.5% | 77.3% |
| Range | 28.5% | 74.2% |
| Mean | 12.7% | 30.4% |
| Median | 11.6% | 25.8% |
| Interquartile 25% (IQ1) | 8.0% | 15.6% |
| Interquartile 75% (IQ3) | 16.2% | 47.0% |
| Interquartile Range (IQR) | 8.3% | 31.5% |
| Standard Deviation (Sample) | 6.2% | 18.8% |
| Standard Deviation (Population) | 6.1% | 18.6% |
Similar Demographics by Male Poverty
Demographics Similar to Cape Verdeans by Male Poverty
In terms of male poverty, the demographic groups most similar to Cape Verdeans are Immigrants from Trinidad and Tobago (13.1%, a difference of 0.13%), Cherokee (13.1%, a difference of 0.16%), Ottawa (13.1%, a difference of 0.28%), Trinidadian and Tobagonian (13.1%, a difference of 0.30%), and Spanish American Indian (13.1%, a difference of 0.35%).
| Demographics | Rating | Rank | Male Poverty |
| Immigrants | Cuba | 0.2 /100 | #251 | Tragic 12.9% |
| Immigrants | Ecuador | 0.2 /100 | #252 | Tragic 12.9% |
| Immigrants | Ghana | 0.2 /100 | #253 | Tragic 12.9% |
| Mexican American Indians | 0.1 /100 | #254 | Tragic 13.0% |
| Immigrants | Liberia | 0.1 /100 | #255 | Tragic 13.0% |
| Immigrants | Burma/Myanmar | 0.1 /100 | #256 | Tragic 13.0% |
| Immigrants | Trinidad and Tobago | 0.1 /100 | #257 | Tragic 13.1% |
| Cape Verdeans | 0.1 /100 | #258 | Tragic 13.1% |
| Cherokee | 0.1 /100 | #259 | Tragic 13.1% |
| Ottawa | 0.1 /100 | #260 | Tragic 13.1% |
| Trinidadians and Tobagonians | 0.1 /100 | #261 | Tragic 13.1% |
| Spanish American Indians | 0.1 /100 | #262 | Tragic 13.1% |
| Central Americans | 0.1 /100 | #263 | Tragic 13.2% |
| Iroquois | 0.1 /100 | #264 | Tragic 13.2% |
| Jamaicans | 0.1 /100 | #265 | Tragic 13.2% |
Demographics Similar to Apache by Male Poverty
In terms of male poverty, the demographic groups most similar to Apache are Cheyenne (17.6%, a difference of 0.20%), Native/Alaskan (16.9%, a difference of 4.4%), Pueblo (18.5%, a difference of 4.8%), Houma (16.7%, a difference of 5.7%), and Sioux (18.7%, a difference of 5.9%).
| Demographics | Rating | Rank | Male Poverty |
| Blacks/African Americans | 0.0 /100 | #328 | Tragic 15.8% |
| Dominicans | 0.0 /100 | #329 | Tragic 16.1% |
| Immigrants | Dominican Republic | 0.0 /100 | #330 | Tragic 16.2% |
| Ute | 0.0 /100 | #331 | Tragic 16.2% |
| Houma | 0.0 /100 | #332 | Tragic 16.7% |
| Natives/Alaskans | 0.0 /100 | #333 | Tragic 16.9% |
| Cheyenne | 0.0 /100 | #334 | Tragic 17.6% |
| Apache | 0.0 /100 | #335 | Tragic 17.7% |
| Pueblo | 0.0 /100 | #336 | Tragic 18.5% |
| Sioux | 0.0 /100 | #337 | Tragic 18.7% |
| Crow | 0.0 /100 | #338 | Tragic 19.1% |
| Yuman | 0.0 /100 | #339 | Tragic 19.5% |
| Immigrants | Yemen | 0.0 /100 | #340 | Tragic 20.1% |
| Lumbee | 0.0 /100 | #341 | Tragic 20.2% |
| Pima | 0.0 /100 | #342 | Tragic 20.4% |