Australian vs Apache Male Poverty
COMPARE
Australian
Apache
Male Poverty
Male Poverty Comparison
Australians
Apache
10.4%
MALE POVERTY
94.4/ 100
METRIC RATING
93rd/ 347
METRIC RANK
17.7%
MALE POVERTY
0.0/ 100
METRIC RATING
335th/ 347
METRIC RANK
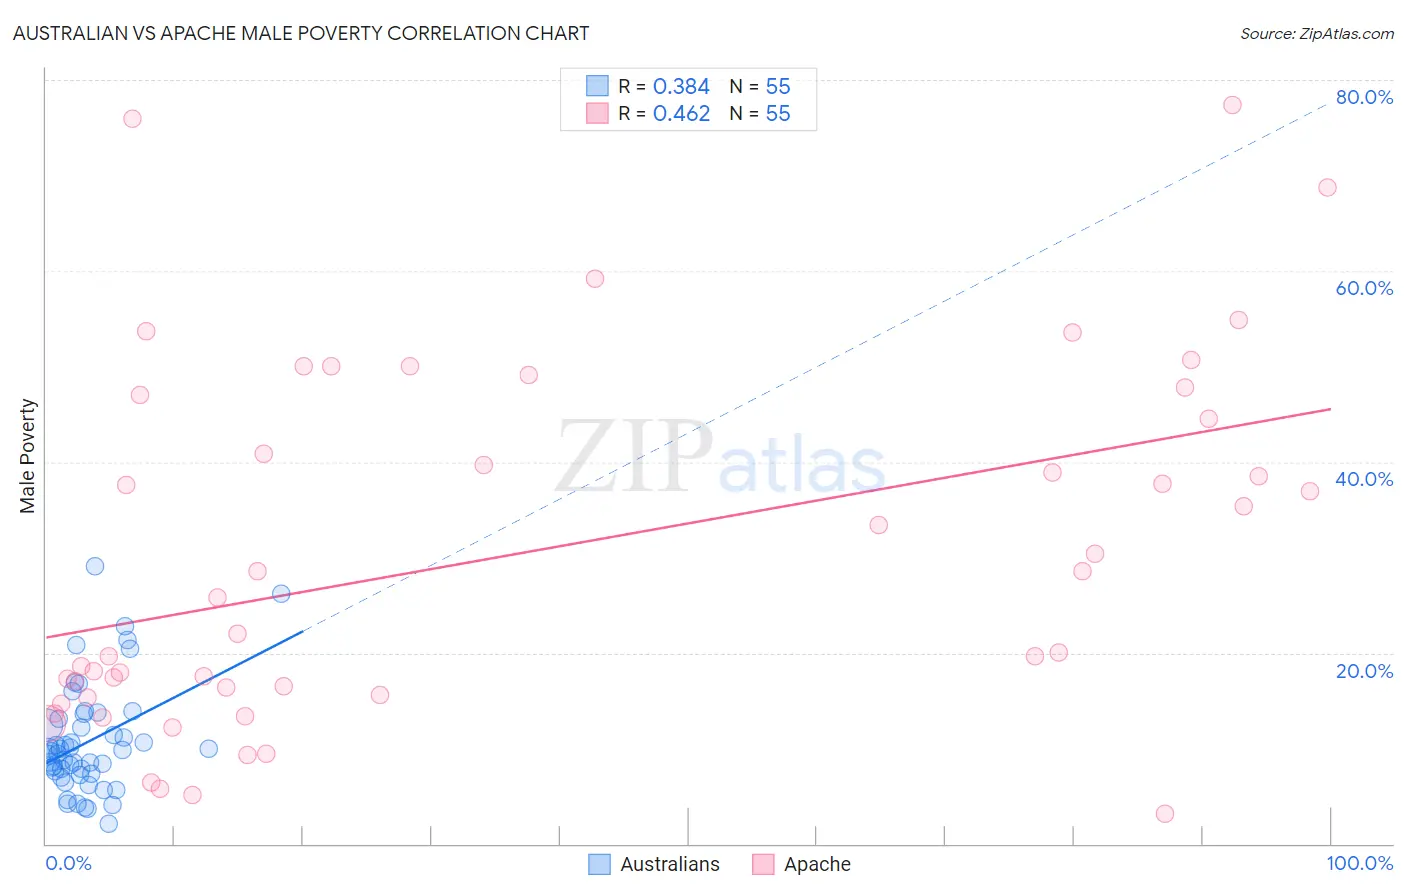
Australian vs Apache Male Poverty Correlation Chart
The statistical analysis conducted on geographies consisting of 223,991,142 people shows a mild positive correlation between the proportion of Australians and poverty level among males in the United States with a correlation coefficient (R) of 0.384 and weighted average of 10.4%. Similarly, the statistical analysis conducted on geographies consisting of 231,014,108 people shows a moderate positive correlation between the proportion of Apache and poverty level among males in the United States with a correlation coefficient (R) of 0.462 and weighted average of 17.7%, a difference of 69.7%.
Male Poverty Correlation Summary
| Measurement | Australian | Apache |
| Minimum | 2.1% | 3.1% |
| Maximum | 29.1% | 77.3% |
| Range | 27.0% | 74.2% |
| Mean | 10.7% | 30.4% |
| Median | 9.7% | 25.8% |
| Interquartile 25% (IQ1) | 7.3% | 15.6% |
| Interquartile 75% (IQ3) | 13.1% | 47.0% |
| Interquartile Range (IQR) | 5.9% | 31.5% |
| Standard Deviation (Sample) | 5.7% | 18.8% |
| Standard Deviation (Population) | 5.6% | 18.6% |
Similar Demographics by Male Poverty
Demographics Similar to Australians by Male Poverty
In terms of male poverty, the demographic groups most similar to Australians are Jordanian (10.4%, a difference of 0.0%), Immigrants from South Africa (10.4%, a difference of 0.17%), British (10.4%, a difference of 0.20%), Scottish (10.4%, a difference of 0.20%), and Indian (Asian) (10.4%, a difference of 0.27%).
| Demographics | Rating | Rank | Male Poverty |
| Immigrants | Eastern Asia | 95.3 /100 | #86 | Exceptional 10.4% |
| Northern Europeans | 95.2 /100 | #87 | Exceptional 10.4% |
| Cambodians | 95.0 /100 | #88 | Exceptional 10.4% |
| Immigrants | Denmark | 95.0 /100 | #89 | Exceptional 10.4% |
| Indians (Asian) | 94.9 /100 | #90 | Exceptional 10.4% |
| British | 94.8 /100 | #91 | Exceptional 10.4% |
| Jordanians | 94.4 /100 | #92 | Exceptional 10.4% |
| Australians | 94.4 /100 | #93 | Exceptional 10.4% |
| Immigrants | South Africa | 94.1 /100 | #94 | Exceptional 10.4% |
| Scottish | 94.0 /100 | #95 | Exceptional 10.4% |
| Immigrants | Egypt | 93.7 /100 | #96 | Exceptional 10.4% |
| Romanians | 93.6 /100 | #97 | Exceptional 10.5% |
| Finns | 93.4 /100 | #98 | Exceptional 10.5% |
| Immigrants | Indonesia | 93.3 /100 | #99 | Exceptional 10.5% |
| Immigrants | Latvia | 92.8 /100 | #100 | Exceptional 10.5% |
Demographics Similar to Apache by Male Poverty
In terms of male poverty, the demographic groups most similar to Apache are Cheyenne (17.6%, a difference of 0.20%), Native/Alaskan (16.9%, a difference of 4.4%), Pueblo (18.5%, a difference of 4.8%), Houma (16.7%, a difference of 5.7%), and Sioux (18.7%, a difference of 5.9%).
| Demographics | Rating | Rank | Male Poverty |
| Blacks/African Americans | 0.0 /100 | #328 | Tragic 15.8% |
| Dominicans | 0.0 /100 | #329 | Tragic 16.1% |
| Immigrants | Dominican Republic | 0.0 /100 | #330 | Tragic 16.2% |
| Ute | 0.0 /100 | #331 | Tragic 16.2% |
| Houma | 0.0 /100 | #332 | Tragic 16.7% |
| Natives/Alaskans | 0.0 /100 | #333 | Tragic 16.9% |
| Cheyenne | 0.0 /100 | #334 | Tragic 17.6% |
| Apache | 0.0 /100 | #335 | Tragic 17.7% |
| Pueblo | 0.0 /100 | #336 | Tragic 18.5% |
| Sioux | 0.0 /100 | #337 | Tragic 18.7% |
| Crow | 0.0 /100 | #338 | Tragic 19.1% |
| Yuman | 0.0 /100 | #339 | Tragic 19.5% |
| Immigrants | Yemen | 0.0 /100 | #340 | Tragic 20.1% |
| Lumbee | 0.0 /100 | #341 | Tragic 20.2% |
| Pima | 0.0 /100 | #342 | Tragic 20.4% |