British West Indian vs Apache Male Poverty
COMPARE
British West Indian
Apache
Male Poverty
Male Poverty Comparison
British West Indians
Apache
14.6%
MALE POVERTY
0.0/ 100
METRIC RATING
316th/ 347
METRIC RANK
17.7%
MALE POVERTY
0.0/ 100
METRIC RATING
335th/ 347
METRIC RANK
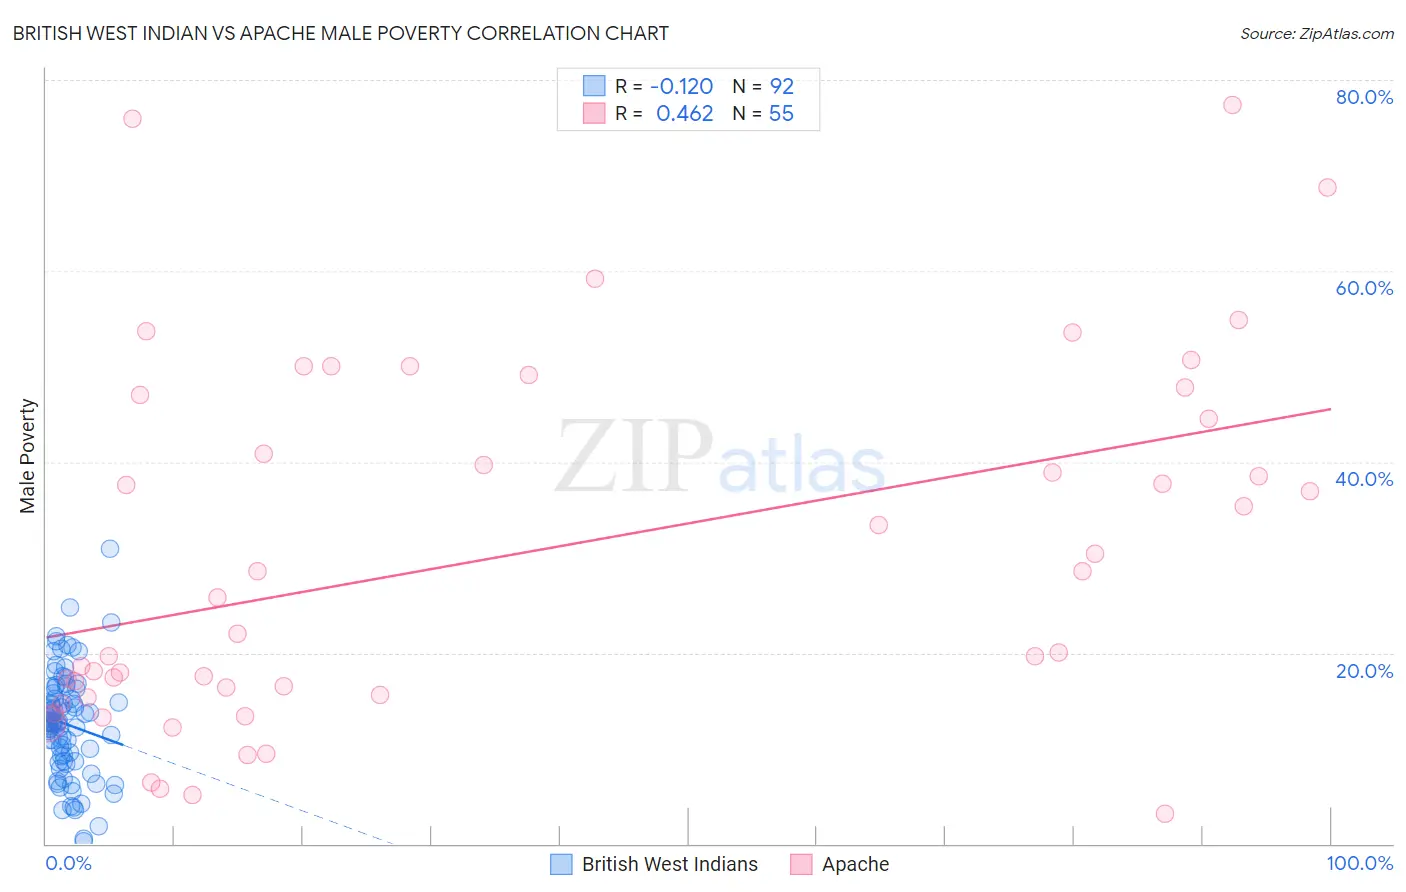
British West Indian vs Apache Male Poverty Correlation Chart
The statistical analysis conducted on geographies consisting of 152,618,428 people shows a poor negative correlation between the proportion of British West Indians and poverty level among males in the United States with a correlation coefficient (R) of -0.120 and weighted average of 14.6%. Similarly, the statistical analysis conducted on geographies consisting of 231,014,108 people shows a moderate positive correlation between the proportion of Apache and poverty level among males in the United States with a correlation coefficient (R) of 0.462 and weighted average of 17.7%, a difference of 21.0%.
Male Poverty Correlation Summary
| Measurement | British West Indian | Apache |
| Minimum | 0.21% | 3.1% |
| Maximum | 30.9% | 77.3% |
| Range | 30.7% | 74.2% |
| Mean | 12.5% | 30.4% |
| Median | 12.7% | 25.8% |
| Interquartile 25% (IQ1) | 8.9% | 15.6% |
| Interquartile 75% (IQ3) | 15.5% | 47.0% |
| Interquartile Range (IQR) | 6.6% | 31.5% |
| Standard Deviation (Sample) | 5.5% | 18.8% |
| Standard Deviation (Population) | 5.5% | 18.6% |
Demographics Similar to British West Indians and Apache by Male Poverty
In terms of male poverty, the demographic groups most similar to British West Indians are Chippewa (14.6%, a difference of 0.020%), Immigrants from Dominica (14.7%, a difference of 0.68%), Immigrants from Grenada (14.7%, a difference of 0.74%), U.S. Virgin Islander (14.7%, a difference of 0.76%), and Immigrants from Congo (14.7%, a difference of 0.86%). Similarly, the demographic groups most similar to Apache are Cheyenne (17.6%, a difference of 0.20%), Native/Alaskan (16.9%, a difference of 4.4%), Houma (16.7%, a difference of 5.7%), Ute (16.2%, a difference of 8.8%), and Immigrants from Dominican Republic (16.2%, a difference of 9.1%).
| Demographics | Rating | Rank | Male Poverty |
| Chippewa | 0.0 /100 | #315 | Tragic 14.6% |
| British West Indians | 0.0 /100 | #316 | Tragic 14.6% |
| Immigrants | Dominica | 0.0 /100 | #317 | Tragic 14.7% |
| Immigrants | Grenada | 0.0 /100 | #318 | Tragic 14.7% |
| U.S. Virgin Islanders | 0.0 /100 | #319 | Tragic 14.7% |
| Immigrants | Congo | 0.0 /100 | #320 | Tragic 14.7% |
| Arapaho | 0.0 /100 | #321 | Tragic 15.1% |
| Kiowa | 0.0 /100 | #322 | Tragic 15.2% |
| Colville | 0.0 /100 | #323 | Tragic 15.2% |
| Menominee | 0.0 /100 | #324 | Tragic 15.3% |
| Yakama | 0.0 /100 | #325 | Tragic 15.3% |
| Central American Indians | 0.0 /100 | #326 | Tragic 15.3% |
| Paiute | 0.0 /100 | #327 | Tragic 15.8% |
| Blacks/African Americans | 0.0 /100 | #328 | Tragic 15.8% |
| Dominicans | 0.0 /100 | #329 | Tragic 16.1% |
| Immigrants | Dominican Republic | 0.0 /100 | #330 | Tragic 16.2% |
| Ute | 0.0 /100 | #331 | Tragic 16.2% |
| Houma | 0.0 /100 | #332 | Tragic 16.7% |
| Natives/Alaskans | 0.0 /100 | #333 | Tragic 16.9% |
| Cheyenne | 0.0 /100 | #334 | Tragic 17.6% |
| Apache | 0.0 /100 | #335 | Tragic 17.7% |