Austrian vs Apache Male Poverty
COMPARE
Austrian
Apache
Male Poverty
Male Poverty Comparison
Austrians
Apache
10.1%
MALE POVERTY
97.8/ 100
METRIC RATING
61st/ 347
METRIC RANK
17.7%
MALE POVERTY
0.0/ 100
METRIC RATING
335th/ 347
METRIC RANK
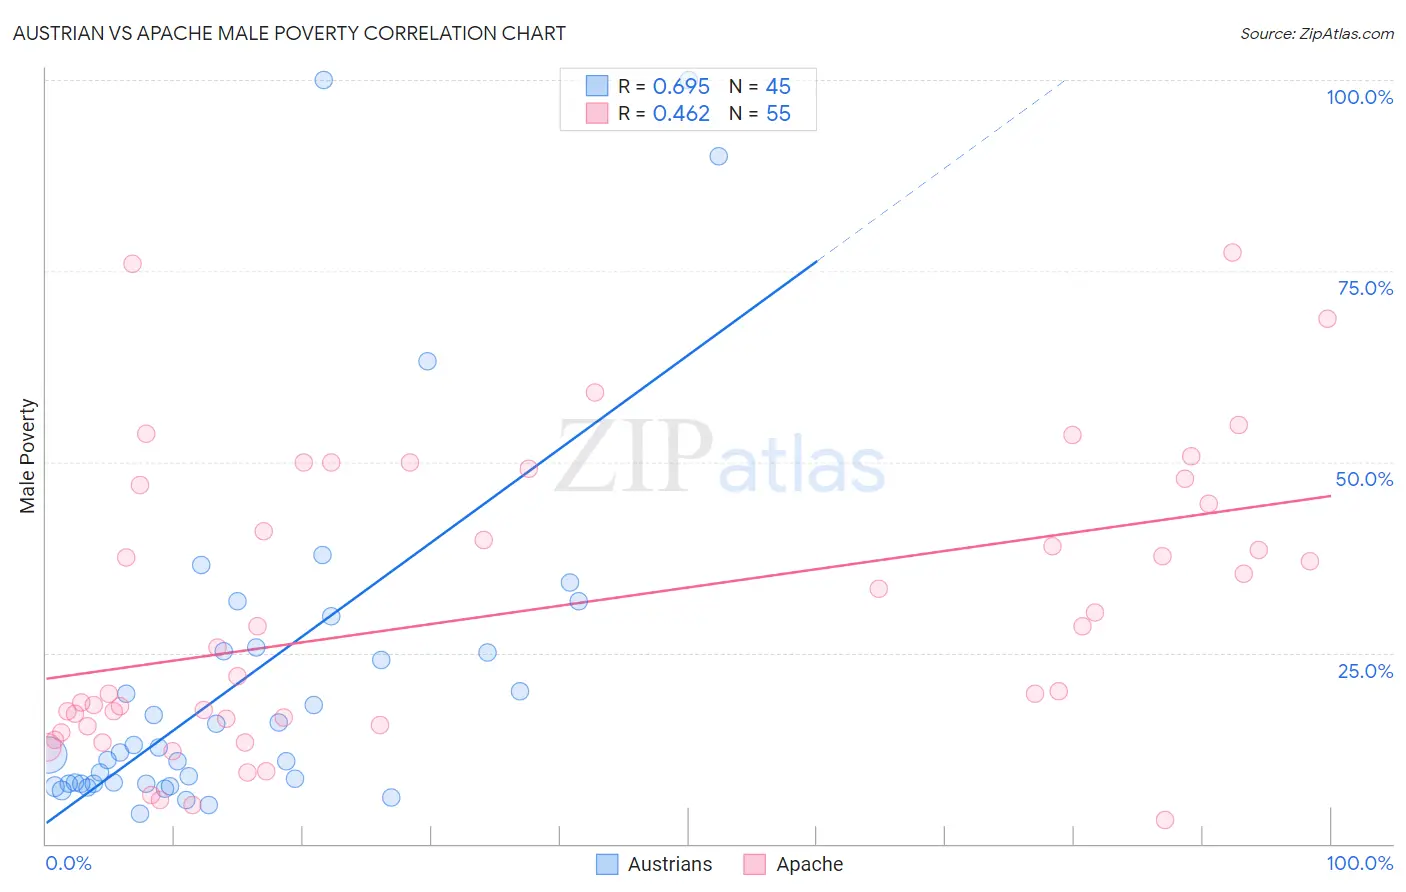
Austrian vs Apache Male Poverty Correlation Chart
The statistical analysis conducted on geographies consisting of 451,474,043 people shows a significant positive correlation between the proportion of Austrians and poverty level among males in the United States with a correlation coefficient (R) of 0.695 and weighted average of 10.1%. Similarly, the statistical analysis conducted on geographies consisting of 231,014,108 people shows a moderate positive correlation between the proportion of Apache and poverty level among males in the United States with a correlation coefficient (R) of 0.462 and weighted average of 17.7%, a difference of 74.2%.
Male Poverty Correlation Summary
| Measurement | Austrian | Apache |
| Minimum | 4.0% | 3.1% |
| Maximum | 100.0% | 77.3% |
| Range | 96.0% | 74.2% |
| Mean | 21.7% | 30.4% |
| Median | 11.9% | 25.8% |
| Interquartile 25% (IQ1) | 7.9% | 15.6% |
| Interquartile 75% (IQ3) | 25.5% | 47.0% |
| Interquartile Range (IQR) | 17.6% | 31.5% |
| Standard Deviation (Sample) | 23.4% | 18.8% |
| Standard Deviation (Population) | 23.2% | 18.6% |
Similar Demographics by Male Poverty
Demographics Similar to Austrians by Male Poverty
In terms of male poverty, the demographic groups most similar to Austrians are Ukrainian (10.1%, a difference of 0.020%), Immigrants from Italy (10.2%, a difference of 0.090%), Immigrants from Europe (10.1%, a difference of 0.11%), Slovak (10.2%, a difference of 0.13%), and Scandinavian (10.1%, a difference of 0.24%).
| Demographics | Rating | Rank | Male Poverty |
| Immigrants | Austria | 98.5 /100 | #54 | Exceptional 10.0% |
| Germans | 98.3 /100 | #55 | Exceptional 10.1% |
| Immigrants | Bulgaria | 98.2 /100 | #56 | Exceptional 10.1% |
| Estonians | 98.1 /100 | #57 | Exceptional 10.1% |
| Scandinavians | 98.0 /100 | #58 | Exceptional 10.1% |
| Immigrants | Europe | 97.9 /100 | #59 | Exceptional 10.1% |
| Ukrainians | 97.9 /100 | #60 | Exceptional 10.1% |
| Austrians | 97.8 /100 | #61 | Exceptional 10.1% |
| Immigrants | Italy | 97.8 /100 | #62 | Exceptional 10.2% |
| Slovaks | 97.7 /100 | #63 | Exceptional 10.2% |
| Swiss | 97.5 /100 | #64 | Exceptional 10.2% |
| Zimbabweans | 97.5 /100 | #65 | Exceptional 10.2% |
| Serbians | 97.5 /100 | #66 | Exceptional 10.2% |
| Immigrants | Netherlands | 97.3 /100 | #67 | Exceptional 10.2% |
| Immigrants | Sri Lanka | 97.2 /100 | #68 | Exceptional 10.2% |
Demographics Similar to Apache by Male Poverty
In terms of male poverty, the demographic groups most similar to Apache are Cheyenne (17.6%, a difference of 0.20%), Native/Alaskan (16.9%, a difference of 4.4%), Pueblo (18.5%, a difference of 4.8%), Houma (16.7%, a difference of 5.7%), and Sioux (18.7%, a difference of 5.9%).
| Demographics | Rating | Rank | Male Poverty |
| Blacks/African Americans | 0.0 /100 | #328 | Tragic 15.8% |
| Dominicans | 0.0 /100 | #329 | Tragic 16.1% |
| Immigrants | Dominican Republic | 0.0 /100 | #330 | Tragic 16.2% |
| Ute | 0.0 /100 | #331 | Tragic 16.2% |
| Houma | 0.0 /100 | #332 | Tragic 16.7% |
| Natives/Alaskans | 0.0 /100 | #333 | Tragic 16.9% |
| Cheyenne | 0.0 /100 | #334 | Tragic 17.6% |
| Apache | 0.0 /100 | #335 | Tragic 17.7% |
| Pueblo | 0.0 /100 | #336 | Tragic 18.5% |
| Sioux | 0.0 /100 | #337 | Tragic 18.7% |
| Crow | 0.0 /100 | #338 | Tragic 19.1% |
| Yuman | 0.0 /100 | #339 | Tragic 19.5% |
| Immigrants | Yemen | 0.0 /100 | #340 | Tragic 20.1% |
| Lumbee | 0.0 /100 | #341 | Tragic 20.2% |
| Pima | 0.0 /100 | #342 | Tragic 20.4% |