Cape Verdean vs Immigrants from India Male Poverty
COMPARE
Cape Verdean
Immigrants from India
Male Poverty
Male Poverty Comparison
Cape Verdeans
Immigrants from India
13.1%
MALE POVERTY
0.1/ 100
METRIC RATING
258th/ 347
METRIC RANK
8.2%
MALE POVERTY
100.0/ 100
METRIC RATING
1st/ 347
METRIC RANK
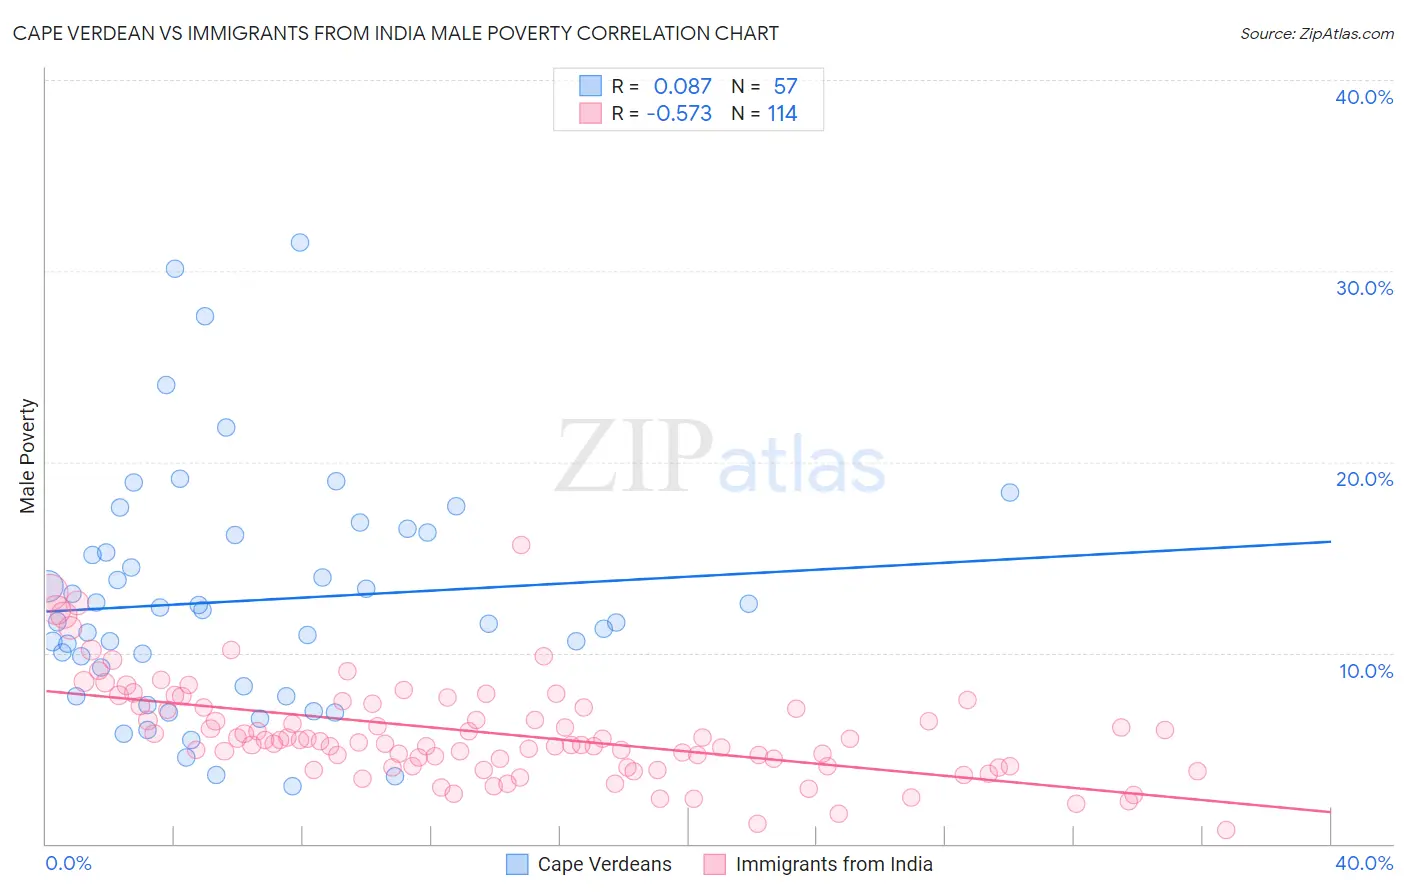
Cape Verdean vs Immigrants from India Male Poverty Correlation Chart
The statistical analysis conducted on geographies consisting of 107,527,352 people shows a slight positive correlation between the proportion of Cape Verdeans and poverty level among males in the United States with a correlation coefficient (R) of 0.087 and weighted average of 13.1%. Similarly, the statistical analysis conducted on geographies consisting of 433,533,379 people shows a substantial negative correlation between the proportion of Immigrants from India and poverty level among males in the United States with a correlation coefficient (R) of -0.573 and weighted average of 8.2%, a difference of 59.7%.
Male Poverty Correlation Summary
| Measurement | Cape Verdean | Immigrants from India |
| Minimum | 3.0% | 0.74% |
| Maximum | 31.5% | 15.6% |
| Range | 28.5% | 14.9% |
| Mean | 12.7% | 5.8% |
| Median | 11.6% | 5.4% |
| Interquartile 25% (IQ1) | 8.0% | 4.1% |
| Interquartile 75% (IQ3) | 16.2% | 7.2% |
| Interquartile Range (IQR) | 8.3% | 3.2% |
| Standard Deviation (Sample) | 6.2% | 2.6% |
| Standard Deviation (Population) | 6.1% | 2.6% |
Similar Demographics by Male Poverty
Demographics Similar to Cape Verdeans by Male Poverty
In terms of male poverty, the demographic groups most similar to Cape Verdeans are Immigrants from Trinidad and Tobago (13.1%, a difference of 0.13%), Cherokee (13.1%, a difference of 0.16%), Ottawa (13.1%, a difference of 0.28%), Trinidadian and Tobagonian (13.1%, a difference of 0.30%), and Spanish American Indian (13.1%, a difference of 0.35%).
| Demographics | Rating | Rank | Male Poverty |
| Immigrants | Cuba | 0.2 /100 | #251 | Tragic 12.9% |
| Immigrants | Ecuador | 0.2 /100 | #252 | Tragic 12.9% |
| Immigrants | Ghana | 0.2 /100 | #253 | Tragic 12.9% |
| Mexican American Indians | 0.1 /100 | #254 | Tragic 13.0% |
| Immigrants | Liberia | 0.1 /100 | #255 | Tragic 13.0% |
| Immigrants | Burma/Myanmar | 0.1 /100 | #256 | Tragic 13.0% |
| Immigrants | Trinidad and Tobago | 0.1 /100 | #257 | Tragic 13.1% |
| Cape Verdeans | 0.1 /100 | #258 | Tragic 13.1% |
| Cherokee | 0.1 /100 | #259 | Tragic 13.1% |
| Ottawa | 0.1 /100 | #260 | Tragic 13.1% |
| Trinidadians and Tobagonians | 0.1 /100 | #261 | Tragic 13.1% |
| Spanish American Indians | 0.1 /100 | #262 | Tragic 13.1% |
| Central Americans | 0.1 /100 | #263 | Tragic 13.2% |
| Iroquois | 0.1 /100 | #264 | Tragic 13.2% |
| Jamaicans | 0.1 /100 | #265 | Tragic 13.2% |
Demographics Similar to Immigrants from India by Male Poverty
In terms of male poverty, the demographic groups most similar to Immigrants from India are Chinese (8.7%, a difference of 6.2%), Thai (8.7%, a difference of 6.2%), Immigrants from Taiwan (8.9%, a difference of 8.7%), Maltese (9.1%, a difference of 10.9%), and Assyrian/Chaldean/Syriac (9.1%, a difference of 11.6%).
| Demographics | Rating | Rank | Male Poverty |
| Immigrants | India | 100.0 /100 | #1 | Exceptional 8.2% |
| Chinese | 100.0 /100 | #2 | Exceptional 8.7% |
| Thais | 100.0 /100 | #3 | Exceptional 8.7% |
| Immigrants | Taiwan | 100.0 /100 | #4 | Exceptional 8.9% |
| Maltese | 100.0 /100 | #5 | Exceptional 9.1% |
| Assyrians/Chaldeans/Syriacs | 99.9 /100 | #6 | Exceptional 9.1% |
| Immigrants | Ireland | 99.9 /100 | #7 | Exceptional 9.1% |
| Filipinos | 99.9 /100 | #8 | Exceptional 9.2% |
| Immigrants | South Central Asia | 99.9 /100 | #9 | Exceptional 9.3% |
| Bulgarians | 99.9 /100 | #10 | Exceptional 9.3% |
| Bolivians | 99.9 /100 | #11 | Exceptional 9.4% |
| Immigrants | Bolivia | 99.9 /100 | #12 | Exceptional 9.4% |
| Immigrants | Lithuania | 99.9 /100 | #13 | Exceptional 9.4% |
| Immigrants | North Macedonia | 99.8 /100 | #14 | Exceptional 9.4% |
| Bhutanese | 99.8 /100 | #15 | Exceptional 9.5% |