Yakama vs Apache Male Poverty
COMPARE
Yakama
Apache
Male Poverty
Male Poverty Comparison
Yakama
Apache
15.3%
MALE POVERTY
0.0/ 100
METRIC RATING
325th/ 347
METRIC RANK
17.7%
MALE POVERTY
0.0/ 100
METRIC RATING
335th/ 347
METRIC RANK
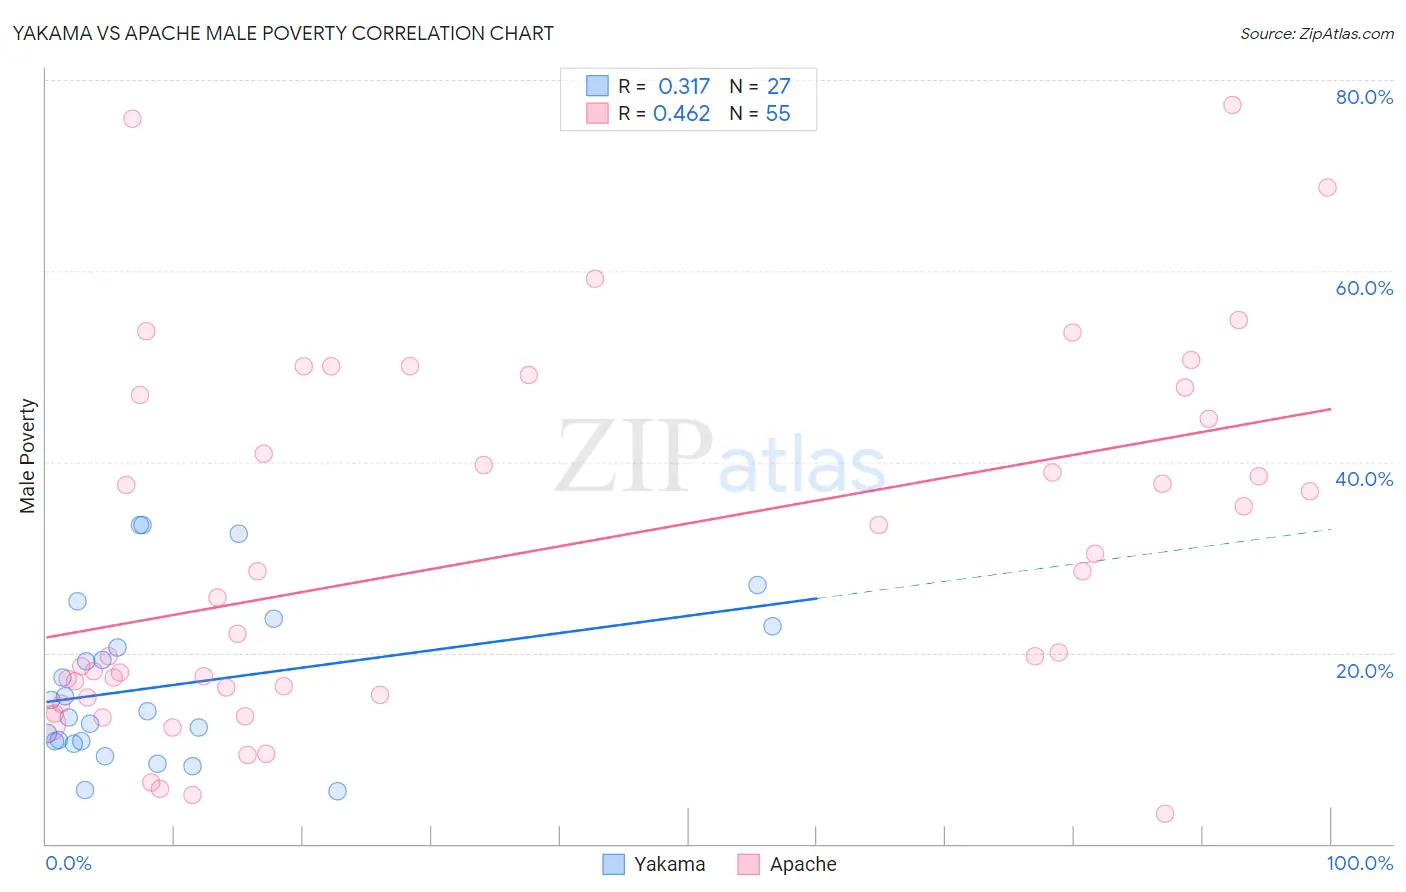
Yakama vs Apache Male Poverty Correlation Chart
The statistical analysis conducted on geographies consisting of 19,917,879 people shows a mild positive correlation between the proportion of Yakama and poverty level among males in the United States with a correlation coefficient (R) of 0.317 and weighted average of 15.3%. Similarly, the statistical analysis conducted on geographies consisting of 231,014,108 people shows a moderate positive correlation between the proportion of Apache and poverty level among males in the United States with a correlation coefficient (R) of 0.462 and weighted average of 17.7%, a difference of 15.4%.
Male Poverty Correlation Summary
| Measurement | Yakama | Apache |
| Minimum | 5.5% | 3.1% |
| Maximum | 33.3% | 77.3% |
| Range | 27.9% | 74.2% |
| Mean | 16.6% | 30.4% |
| Median | 13.8% | 25.8% |
| Interquartile 25% (IQ1) | 10.7% | 15.6% |
| Interquartile 75% (IQ3) | 22.7% | 47.0% |
| Interquartile Range (IQR) | 12.1% | 31.5% |
| Standard Deviation (Sample) | 8.3% | 18.8% |
| Standard Deviation (Population) | 8.1% | 18.6% |
Demographics Similar to Yakama and Apache by Male Poverty
In terms of male poverty, the demographic groups most similar to Yakama are Central American Indian (15.3%, a difference of 0.11%), Menominee (15.3%, a difference of 0.18%), Colville (15.2%, a difference of 0.37%), Kiowa (15.2%, a difference of 0.76%), and Arapaho (15.1%, a difference of 1.5%). Similarly, the demographic groups most similar to Apache are Cheyenne (17.6%, a difference of 0.20%), Native/Alaskan (16.9%, a difference of 4.4%), Pueblo (18.5%, a difference of 4.8%), Houma (16.7%, a difference of 5.7%), and Sioux (18.7%, a difference of 5.9%).
| Demographics | Rating | Rank | Male Poverty |
| Immigrants | Congo | 0.0 /100 | #320 | Tragic 14.7% |
| Arapaho | 0.0 /100 | #321 | Tragic 15.1% |
| Kiowa | 0.0 /100 | #322 | Tragic 15.2% |
| Colville | 0.0 /100 | #323 | Tragic 15.2% |
| Menominee | 0.0 /100 | #324 | Tragic 15.3% |
| Yakama | 0.0 /100 | #325 | Tragic 15.3% |
| Central American Indians | 0.0 /100 | #326 | Tragic 15.3% |
| Paiute | 0.0 /100 | #327 | Tragic 15.8% |
| Blacks/African Americans | 0.0 /100 | #328 | Tragic 15.8% |
| Dominicans | 0.0 /100 | #329 | Tragic 16.1% |
| Immigrants | Dominican Republic | 0.0 /100 | #330 | Tragic 16.2% |
| Ute | 0.0 /100 | #331 | Tragic 16.2% |
| Houma | 0.0 /100 | #332 | Tragic 16.7% |
| Natives/Alaskans | 0.0 /100 | #333 | Tragic 16.9% |
| Cheyenne | 0.0 /100 | #334 | Tragic 17.6% |
| Apache | 0.0 /100 | #335 | Tragic 17.7% |
| Pueblo | 0.0 /100 | #336 | Tragic 18.5% |
| Sioux | 0.0 /100 | #337 | Tragic 18.7% |
| Crow | 0.0 /100 | #338 | Tragic 19.1% |
| Yuman | 0.0 /100 | #339 | Tragic 19.5% |
| Immigrants | Yemen | 0.0 /100 | #340 | Tragic 20.1% |