Cape Verdean vs Malaysian Male Poverty
COMPARE
Cape Verdean
Malaysian
Male Poverty
Male Poverty Comparison
Cape Verdeans
Malaysians
13.1%
MALE POVERTY
0.1/ 100
METRIC RATING
258th/ 347
METRIC RANK
12.0%
MALE POVERTY
5.2/ 100
METRIC RATING
207th/ 347
METRIC RANK
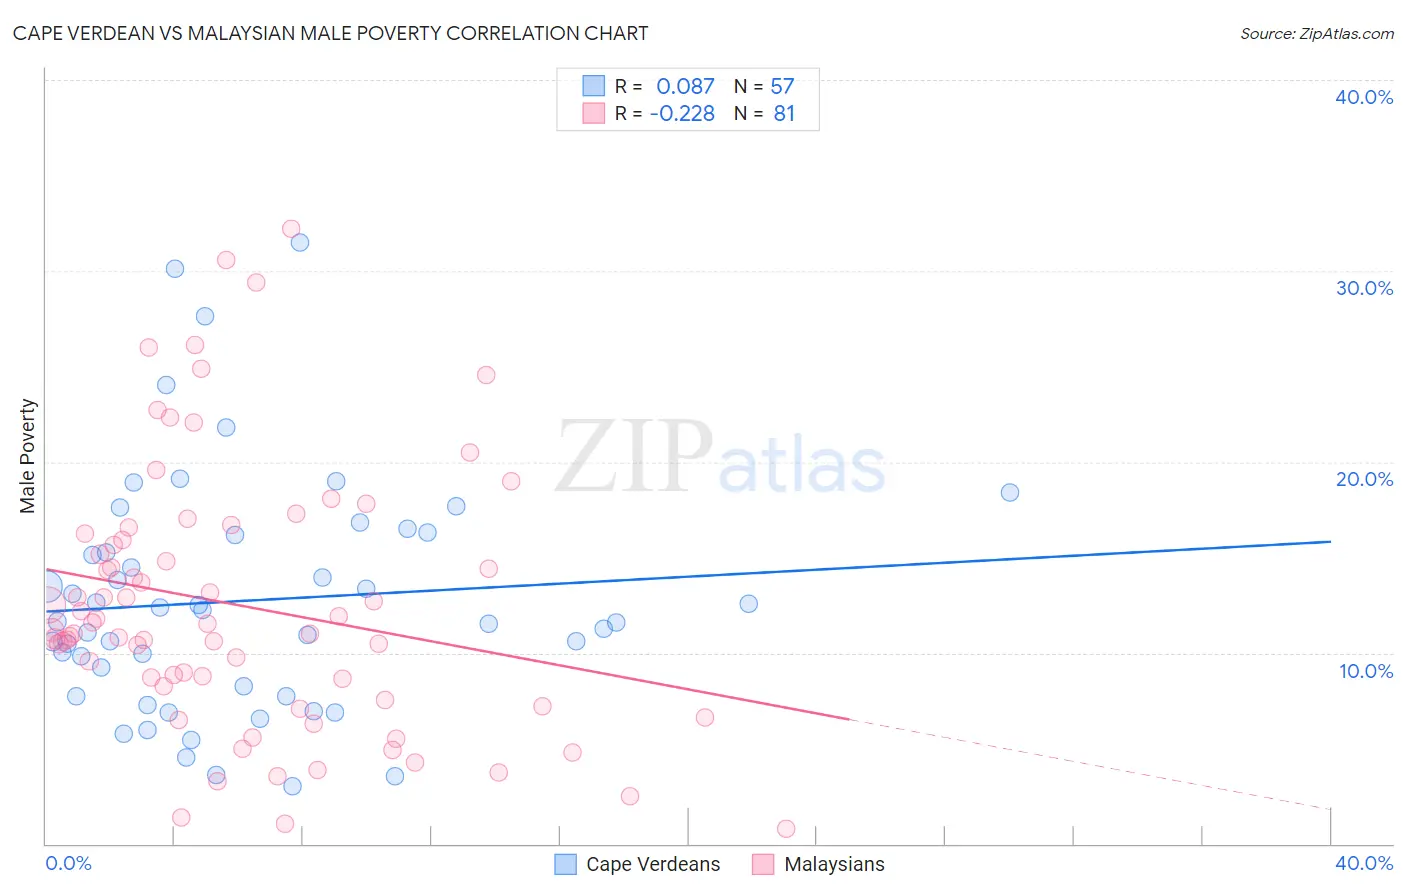
Cape Verdean vs Malaysian Male Poverty Correlation Chart
The statistical analysis conducted on geographies consisting of 107,527,352 people shows a slight positive correlation between the proportion of Cape Verdeans and poverty level among males in the United States with a correlation coefficient (R) of 0.087 and weighted average of 13.1%. Similarly, the statistical analysis conducted on geographies consisting of 225,986,127 people shows a weak negative correlation between the proportion of Malaysians and poverty level among males in the United States with a correlation coefficient (R) of -0.228 and weighted average of 12.0%, a difference of 9.0%.
Male Poverty Correlation Summary
| Measurement | Cape Verdean | Malaysian |
| Minimum | 3.0% | 0.78% |
| Maximum | 31.5% | 32.2% |
| Range | 28.5% | 31.4% |
| Mean | 12.7% | 12.5% |
| Median | 11.6% | 11.2% |
| Interquartile 25% (IQ1) | 8.0% | 7.9% |
| Interquartile 75% (IQ3) | 16.2% | 16.1% |
| Interquartile Range (IQR) | 8.3% | 8.2% |
| Standard Deviation (Sample) | 6.2% | 6.9% |
| Standard Deviation (Population) | 6.1% | 6.9% |
Similar Demographics by Male Poverty
Demographics Similar to Cape Verdeans by Male Poverty
In terms of male poverty, the demographic groups most similar to Cape Verdeans are Immigrants from Trinidad and Tobago (13.1%, a difference of 0.13%), Cherokee (13.1%, a difference of 0.16%), Ottawa (13.1%, a difference of 0.28%), Trinidadian and Tobagonian (13.1%, a difference of 0.30%), and Spanish American Indian (13.1%, a difference of 0.35%).
| Demographics | Rating | Rank | Male Poverty |
| Immigrants | Cuba | 0.2 /100 | #251 | Tragic 12.9% |
| Immigrants | Ecuador | 0.2 /100 | #252 | Tragic 12.9% |
| Immigrants | Ghana | 0.2 /100 | #253 | Tragic 12.9% |
| Mexican American Indians | 0.1 /100 | #254 | Tragic 13.0% |
| Immigrants | Liberia | 0.1 /100 | #255 | Tragic 13.0% |
| Immigrants | Burma/Myanmar | 0.1 /100 | #256 | Tragic 13.0% |
| Immigrants | Trinidad and Tobago | 0.1 /100 | #257 | Tragic 13.1% |
| Cape Verdeans | 0.1 /100 | #258 | Tragic 13.1% |
| Cherokee | 0.1 /100 | #259 | Tragic 13.1% |
| Ottawa | 0.1 /100 | #260 | Tragic 13.1% |
| Trinidadians and Tobagonians | 0.1 /100 | #261 | Tragic 13.1% |
| Spanish American Indians | 0.1 /100 | #262 | Tragic 13.1% |
| Central Americans | 0.1 /100 | #263 | Tragic 13.2% |
| Iroquois | 0.1 /100 | #264 | Tragic 13.2% |
| Jamaicans | 0.1 /100 | #265 | Tragic 13.2% |
Demographics Similar to Malaysians by Male Poverty
In terms of male poverty, the demographic groups most similar to Malaysians are Immigrants from Eastern Africa (12.0%, a difference of 0.10%), Immigrants (12.0%, a difference of 0.33%), Immigrants from the Azores (12.0%, a difference of 0.44%), Panamanian (11.9%, a difference of 0.45%), and Moroccan (12.0%, a difference of 0.50%).
| Demographics | Rating | Rank | Male Poverty |
| Immigrants | Lebanon | 13.6 /100 | #200 | Poor 11.7% |
| Spaniards | 13.5 /100 | #201 | Poor 11.7% |
| Aleuts | 10.4 /100 | #202 | Poor 11.8% |
| Immigrants | Western Asia | 9.8 /100 | #203 | Tragic 11.8% |
| Immigrants | Uganda | 8.5 /100 | #204 | Tragic 11.8% |
| Panamanians | 6.2 /100 | #205 | Tragic 11.9% |
| Immigrants | Eastern Africa | 5.4 /100 | #206 | Tragic 12.0% |
| Malaysians | 5.2 /100 | #207 | Tragic 12.0% |
| Immigrants | Immigrants | 4.5 /100 | #208 | Tragic 12.0% |
| Immigrants | Azores | 4.3 /100 | #209 | Tragic 12.0% |
| Moroccans | 4.2 /100 | #210 | Tragic 12.0% |
| Immigrants | Panama | 4.0 /100 | #211 | Tragic 12.1% |
| Americans | 3.2 /100 | #212 | Tragic 12.1% |
| Immigrants | Nonimmigrants | 3.1 /100 | #213 | Tragic 12.1% |
| Japanese | 2.7 /100 | #214 | Tragic 12.2% |