Cajun vs Paiute Single Female Poverty
COMPARE
Cajun
Paiute
Single Female Poverty
Single Female Poverty Comparison
Cajuns
Paiute
30.6%
SINGLE FEMALE POVERTY
0.0/ 100
METRIC RATING
340th/ 347
METRIC RANK
25.5%
SINGLE FEMALE POVERTY
0.0/ 100
METRIC RATING
312th/ 347
METRIC RANK
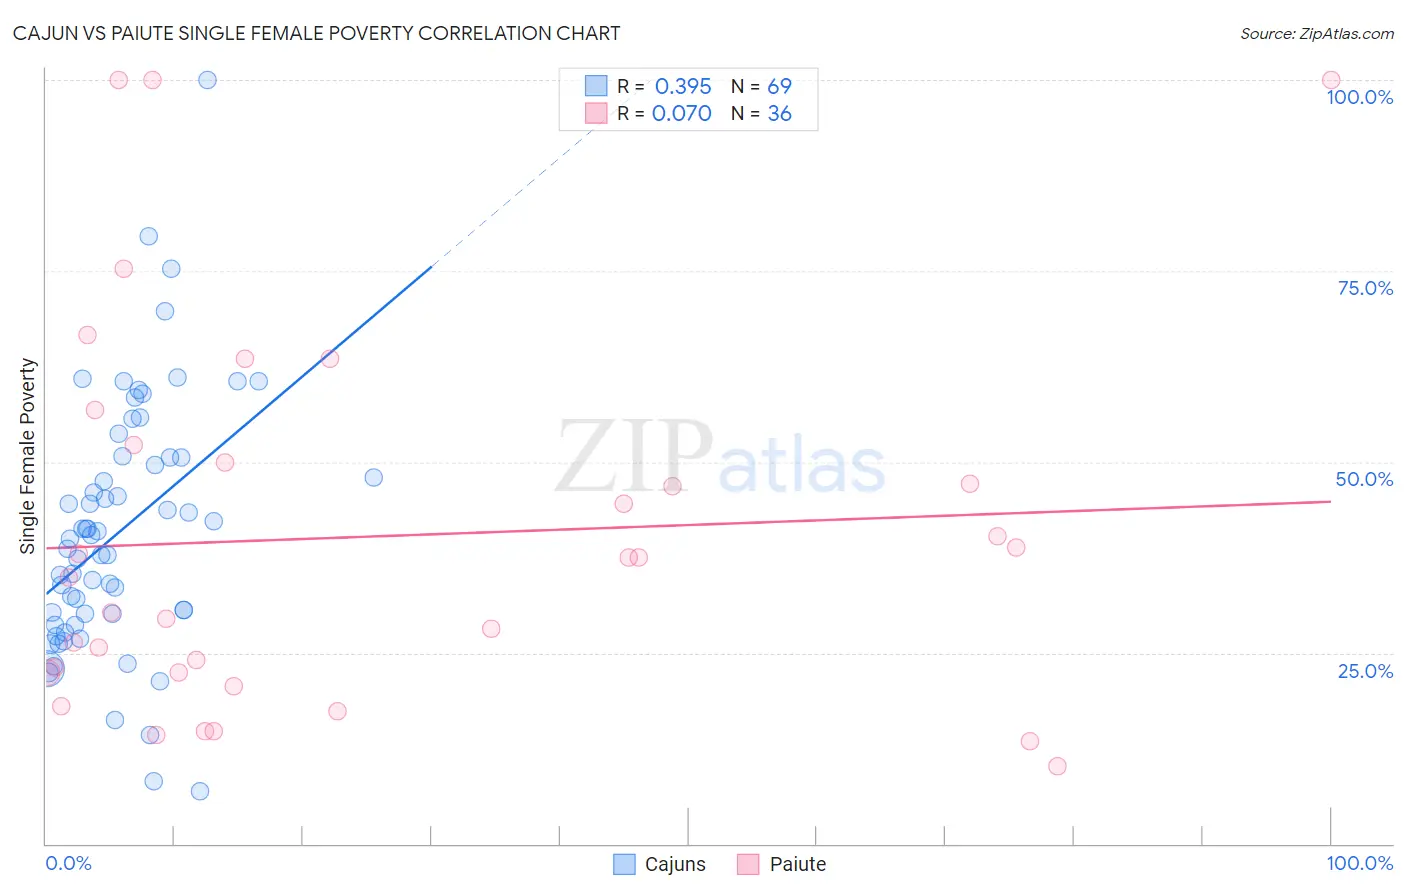
Cajun vs Paiute Single Female Poverty Correlation Chart
The statistical analysis conducted on geographies consisting of 148,582,163 people shows a mild positive correlation between the proportion of Cajuns and poverty level among single females in the United States with a correlation coefficient (R) of 0.395 and weighted average of 30.6%. Similarly, the statistical analysis conducted on geographies consisting of 58,262,204 people shows a slight positive correlation between the proportion of Paiute and poverty level among single females in the United States with a correlation coefficient (R) of 0.070 and weighted average of 25.5%, a difference of 20.0%.
Single Female Poverty Correlation Summary
| Measurement | Cajun | Paiute |
| Minimum | 6.8% | 10.1% |
| Maximum | 100.0% | 100.0% |
| Range | 93.2% | 89.9% |
| Mean | 40.8% | 40.2% |
| Median | 39.9% | 36.2% |
| Interquartile 25% (IQ1) | 29.3% | 22.3% |
| Interquartile 75% (IQ3) | 50.5% | 51.1% |
| Interquartile Range (IQR) | 21.2% | 28.8% |
| Standard Deviation (Sample) | 16.6% | 24.7% |
| Standard Deviation (Population) | 16.5% | 24.4% |
Similar Demographics by Single Female Poverty
Demographics Similar to Cajuns by Single Female Poverty
In terms of single female poverty, the demographic groups most similar to Cajuns are Cheyenne (30.4%, a difference of 0.81%), Pima (30.3%, a difference of 1.0%), Sioux (31.3%, a difference of 2.0%), Navajo (31.7%, a difference of 3.3%), and Yuman (29.4%, a difference of 4.1%).
| Demographics | Rating | Rank | Single Female Poverty |
| Ute | 0.0 /100 | #333 | Tragic 28.4% |
| Pueblo | 0.0 /100 | #334 | Tragic 28.6% |
| Immigrants | Yemen | 0.0 /100 | #335 | Tragic 28.9% |
| Colville | 0.0 /100 | #336 | Tragic 29.1% |
| Yuman | 0.0 /100 | #337 | Tragic 29.4% |
| Pima | 0.0 /100 | #338 | Tragic 30.3% |
| Cheyenne | 0.0 /100 | #339 | Tragic 30.4% |
| Cajuns | 0.0 /100 | #340 | Tragic 30.6% |
| Sioux | 0.0 /100 | #341 | Tragic 31.3% |
| Navajo | 0.0 /100 | #342 | Tragic 31.7% |
| Crow | 0.0 /100 | #343 | Tragic 32.4% |
| Lumbee | 0.0 /100 | #344 | Tragic 33.0% |
| Houma | 0.0 /100 | #345 | Tragic 33.8% |
| Puerto Ricans | 0.0 /100 | #346 | Tragic 34.1% |
| Tohono O'odham | 0.0 /100 | #347 | Tragic 34.2% |
Demographics Similar to Paiute by Single Female Poverty
In terms of single female poverty, the demographic groups most similar to Paiute are Immigrants from Honduras (25.5%, a difference of 0.050%), Comanche (25.6%, a difference of 0.11%), Central American Indian (25.5%, a difference of 0.33%), Cherokee (25.7%, a difference of 0.47%), and Dominican (25.4%, a difference of 0.48%).
| Demographics | Rating | Rank | Single Female Poverty |
| Immigrants | Dominican Republic | 0.0 /100 | #305 | Tragic 25.3% |
| Immigrants | Mexico | 0.0 /100 | #306 | Tragic 25.3% |
| Potawatomi | 0.0 /100 | #307 | Tragic 25.4% |
| Aleuts | 0.0 /100 | #308 | Tragic 25.4% |
| Dominicans | 0.0 /100 | #309 | Tragic 25.4% |
| Central American Indians | 0.0 /100 | #310 | Tragic 25.5% |
| Immigrants | Honduras | 0.0 /100 | #311 | Tragic 25.5% |
| Paiute | 0.0 /100 | #312 | Tragic 25.5% |
| Comanche | 0.0 /100 | #313 | Tragic 25.6% |
| Cherokee | 0.0 /100 | #314 | Tragic 25.7% |
| Iroquois | 0.0 /100 | #315 | Tragic 25.7% |
| Immigrants | Somalia | 0.0 /100 | #316 | Tragic 25.8% |
| Ottawa | 0.0 /100 | #317 | Tragic 26.0% |
| Chickasaw | 0.0 /100 | #318 | Tragic 26.3% |
| Blacks/African Americans | 0.0 /100 | #319 | Tragic 26.4% |