Cajun vs Sierra Leonean Single Female Poverty
COMPARE
Cajun
Sierra Leonean
Single Female Poverty
Single Female Poverty Comparison
Cajuns
Sierra Leoneans
30.6%
SINGLE FEMALE POVERTY
0.0/ 100
METRIC RATING
340th/ 347
METRIC RANK
19.7%
SINGLE FEMALE POVERTY
97.9/ 100
METRIC RATING
99th/ 347
METRIC RANK
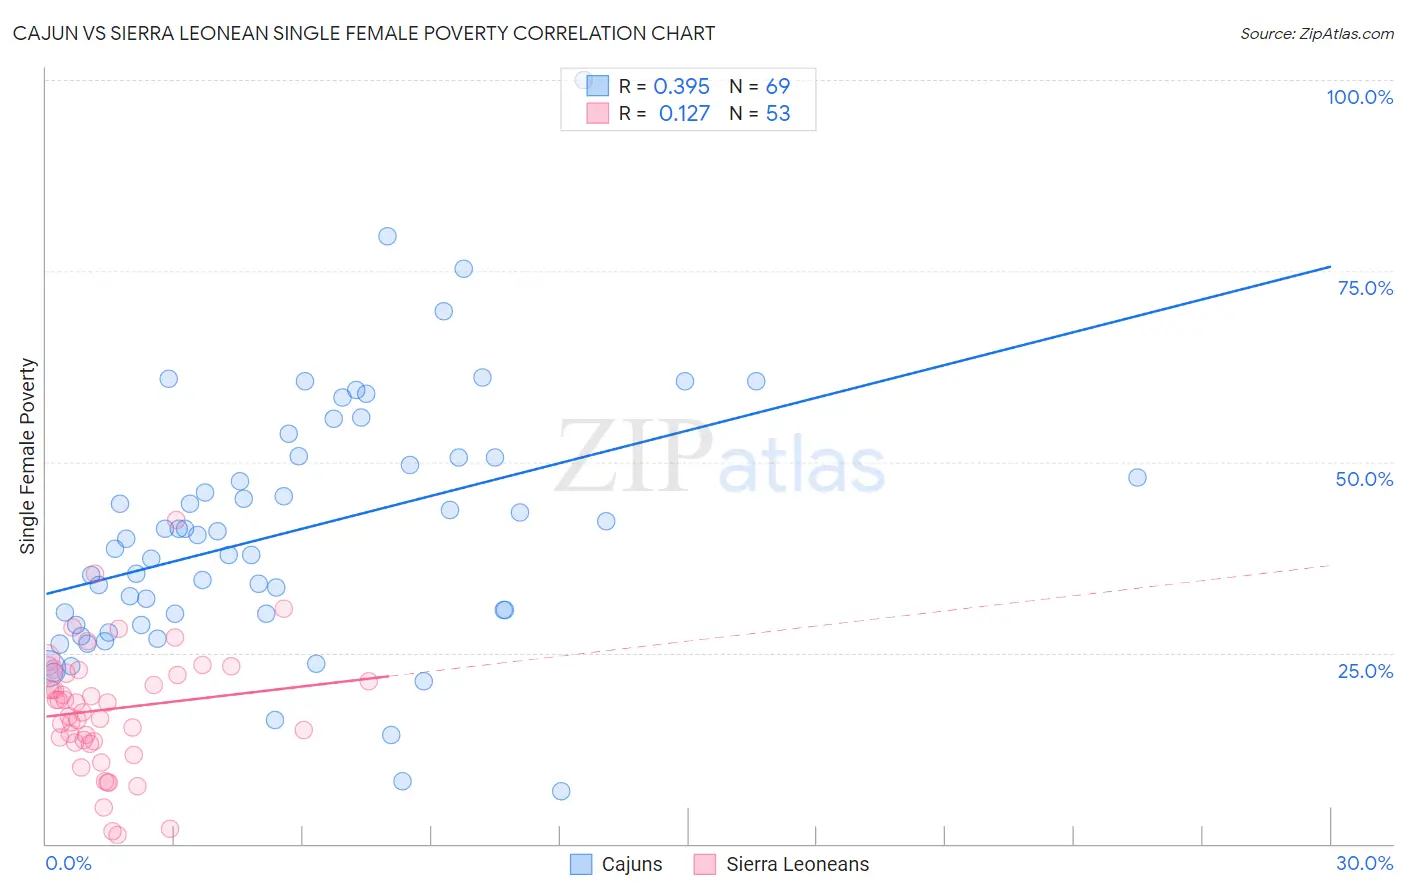
Cajun vs Sierra Leonean Single Female Poverty Correlation Chart
The statistical analysis conducted on geographies consisting of 148,582,163 people shows a mild positive correlation between the proportion of Cajuns and poverty level among single females in the United States with a correlation coefficient (R) of 0.395 and weighted average of 30.6%. Similarly, the statistical analysis conducted on geographies consisting of 83,185,885 people shows a poor positive correlation between the proportion of Sierra Leoneans and poverty level among single females in the United States with a correlation coefficient (R) of 0.127 and weighted average of 19.7%, a difference of 55.2%.
Single Female Poverty Correlation Summary
| Measurement | Cajun | Sierra Leonean |
| Minimum | 6.8% | 1.1% |
| Maximum | 100.0% | 42.4% |
| Range | 93.2% | 41.2% |
| Mean | 40.8% | 17.6% |
| Median | 39.9% | 18.6% |
| Interquartile 25% (IQ1) | 29.3% | 13.4% |
| Interquartile 75% (IQ3) | 50.5% | 22.5% |
| Interquartile Range (IQR) | 21.2% | 9.2% |
| Standard Deviation (Sample) | 16.6% | 8.1% |
| Standard Deviation (Population) | 16.5% | 8.0% |
Similar Demographics by Single Female Poverty
Demographics Similar to Cajuns by Single Female Poverty
In terms of single female poverty, the demographic groups most similar to Cajuns are Cheyenne (30.4%, a difference of 0.81%), Pima (30.3%, a difference of 1.0%), Sioux (31.3%, a difference of 2.0%), Navajo (31.7%, a difference of 3.3%), and Yuman (29.4%, a difference of 4.1%).
| Demographics | Rating | Rank | Single Female Poverty |
| Ute | 0.0 /100 | #333 | Tragic 28.4% |
| Pueblo | 0.0 /100 | #334 | Tragic 28.6% |
| Immigrants | Yemen | 0.0 /100 | #335 | Tragic 28.9% |
| Colville | 0.0 /100 | #336 | Tragic 29.1% |
| Yuman | 0.0 /100 | #337 | Tragic 29.4% |
| Pima | 0.0 /100 | #338 | Tragic 30.3% |
| Cheyenne | 0.0 /100 | #339 | Tragic 30.4% |
| Cajuns | 0.0 /100 | #340 | Tragic 30.6% |
| Sioux | 0.0 /100 | #341 | Tragic 31.3% |
| Navajo | 0.0 /100 | #342 | Tragic 31.7% |
| Crow | 0.0 /100 | #343 | Tragic 32.4% |
| Lumbee | 0.0 /100 | #344 | Tragic 33.0% |
| Houma | 0.0 /100 | #345 | Tragic 33.8% |
| Puerto Ricans | 0.0 /100 | #346 | Tragic 34.1% |
| Tohono O'odham | 0.0 /100 | #347 | Tragic 34.2% |
Demographics Similar to Sierra Leoneans by Single Female Poverty
In terms of single female poverty, the demographic groups most similar to Sierra Leoneans are Immigrants from France (19.7%, a difference of 0.010%), Croatian (19.7%, a difference of 0.14%), Immigrants from Brazil (19.7%, a difference of 0.23%), Ukrainian (19.8%, a difference of 0.25%), and Estonian (19.7%, a difference of 0.28%).
| Demographics | Rating | Rank | Single Female Poverty |
| Italians | 98.8 /100 | #92 | Exceptional 19.6% |
| Immigrants | Austria | 98.8 /100 | #93 | Exceptional 19.6% |
| Romanians | 98.6 /100 | #94 | Exceptional 19.6% |
| Estonians | 98.2 /100 | #95 | Exceptional 19.7% |
| Immigrants | Brazil | 98.2 /100 | #96 | Exceptional 19.7% |
| Croatians | 98.1 /100 | #97 | Exceptional 19.7% |
| Immigrants | France | 97.9 /100 | #98 | Exceptional 19.7% |
| Sierra Leoneans | 97.9 /100 | #99 | Exceptional 19.7% |
| Ukrainians | 97.6 /100 | #100 | Exceptional 19.8% |
| Immigrants | Belgium | 97.3 /100 | #101 | Exceptional 19.8% |
| Immigrants | Cameroon | 97.3 /100 | #102 | Exceptional 19.8% |
| Immigrants | Southern Europe | 97.1 /100 | #103 | Exceptional 19.9% |
| Chileans | 96.9 /100 | #104 | Exceptional 19.9% |
| Israelis | 96.9 /100 | #105 | Exceptional 19.9% |
| Ethiopians | 96.7 /100 | #106 | Exceptional 19.9% |