Colville vs Paiute Single Female Poverty
COMPARE
Colville
Paiute
Single Female Poverty
Single Female Poverty Comparison
Colville
Paiute
29.1%
SINGLE FEMALE POVERTY
0.0/ 100
METRIC RATING
336th/ 347
METRIC RANK
25.5%
SINGLE FEMALE POVERTY
0.0/ 100
METRIC RATING
312th/ 347
METRIC RANK
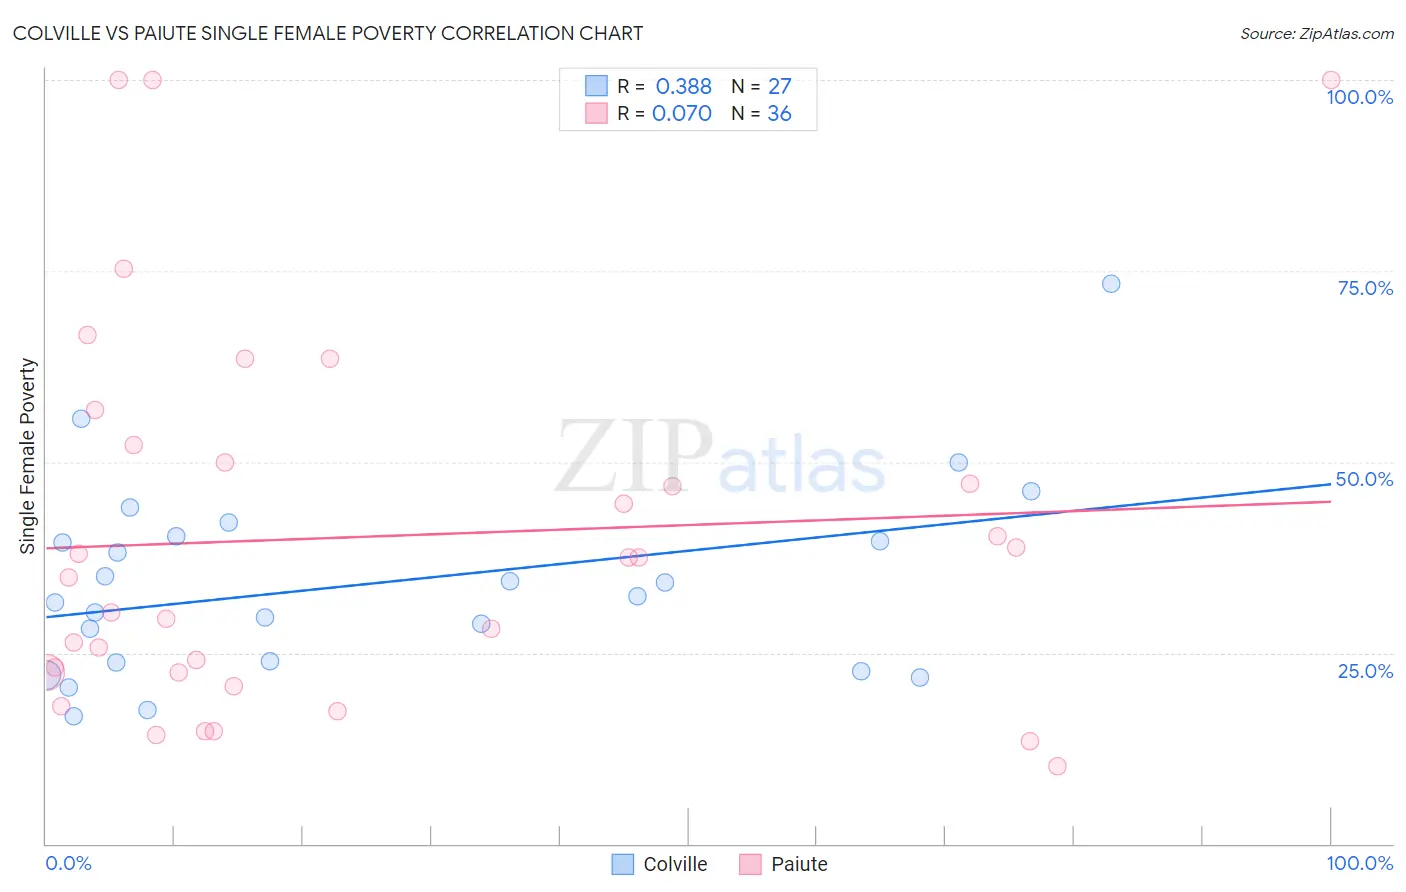
Colville vs Paiute Single Female Poverty Correlation Chart
The statistical analysis conducted on geographies consisting of 34,604,734 people shows a mild positive correlation between the proportion of Colville and poverty level among single females in the United States with a correlation coefficient (R) of 0.388 and weighted average of 29.1%. Similarly, the statistical analysis conducted on geographies consisting of 58,262,204 people shows a slight positive correlation between the proportion of Paiute and poverty level among single females in the United States with a correlation coefficient (R) of 0.070 and weighted average of 25.5%, a difference of 13.9%.
Single Female Poverty Correlation Summary
| Measurement | Colville | Paiute |
| Minimum | 16.7% | 10.1% |
| Maximum | 73.3% | 100.0% |
| Range | 56.6% | 89.9% |
| Mean | 34.2% | 40.2% |
| Median | 32.4% | 36.2% |
| Interquartile 25% (IQ1) | 23.8% | 22.3% |
| Interquartile 75% (IQ3) | 40.2% | 51.1% |
| Interquartile Range (IQR) | 16.4% | 28.8% |
| Standard Deviation (Sample) | 12.7% | 24.7% |
| Standard Deviation (Population) | 12.4% | 24.4% |
Similar Demographics by Single Female Poverty
Demographics Similar to Colville by Single Female Poverty
In terms of single female poverty, the demographic groups most similar to Colville are Immigrants from Yemen (28.9%, a difference of 0.49%), Yuman (29.4%, a difference of 1.3%), Pueblo (28.6%, a difference of 1.6%), Ute (28.4%, a difference of 2.4%), and Yakama (28.3%, a difference of 2.8%).
| Demographics | Rating | Rank | Single Female Poverty |
| Menominee | 0.0 /100 | #329 | Tragic 27.8% |
| Hopi | 0.0 /100 | #330 | Tragic 28.0% |
| Natives/Alaskans | 0.0 /100 | #331 | Tragic 28.2% |
| Yakama | 0.0 /100 | #332 | Tragic 28.3% |
| Ute | 0.0 /100 | #333 | Tragic 28.4% |
| Pueblo | 0.0 /100 | #334 | Tragic 28.6% |
| Immigrants | Yemen | 0.0 /100 | #335 | Tragic 28.9% |
| Colville | 0.0 /100 | #336 | Tragic 29.1% |
| Yuman | 0.0 /100 | #337 | Tragic 29.4% |
| Pima | 0.0 /100 | #338 | Tragic 30.3% |
| Cheyenne | 0.0 /100 | #339 | Tragic 30.4% |
| Cajuns | 0.0 /100 | #340 | Tragic 30.6% |
| Sioux | 0.0 /100 | #341 | Tragic 31.3% |
| Navajo | 0.0 /100 | #342 | Tragic 31.7% |
| Crow | 0.0 /100 | #343 | Tragic 32.4% |
Demographics Similar to Paiute by Single Female Poverty
In terms of single female poverty, the demographic groups most similar to Paiute are Immigrants from Honduras (25.5%, a difference of 0.050%), Comanche (25.6%, a difference of 0.11%), Central American Indian (25.5%, a difference of 0.33%), Cherokee (25.7%, a difference of 0.47%), and Dominican (25.4%, a difference of 0.48%).
| Demographics | Rating | Rank | Single Female Poverty |
| Immigrants | Dominican Republic | 0.0 /100 | #305 | Tragic 25.3% |
| Immigrants | Mexico | 0.0 /100 | #306 | Tragic 25.3% |
| Potawatomi | 0.0 /100 | #307 | Tragic 25.4% |
| Aleuts | 0.0 /100 | #308 | Tragic 25.4% |
| Dominicans | 0.0 /100 | #309 | Tragic 25.4% |
| Central American Indians | 0.0 /100 | #310 | Tragic 25.5% |
| Immigrants | Honduras | 0.0 /100 | #311 | Tragic 25.5% |
| Paiute | 0.0 /100 | #312 | Tragic 25.5% |
| Comanche | 0.0 /100 | #313 | Tragic 25.6% |
| Cherokee | 0.0 /100 | #314 | Tragic 25.7% |
| Iroquois | 0.0 /100 | #315 | Tragic 25.7% |
| Immigrants | Somalia | 0.0 /100 | #316 | Tragic 25.8% |
| Ottawa | 0.0 /100 | #317 | Tragic 26.0% |
| Chickasaw | 0.0 /100 | #318 | Tragic 26.3% |
| Blacks/African Americans | 0.0 /100 | #319 | Tragic 26.4% |