Immigrants from Central America vs Paiute Single Female Poverty
COMPARE
Immigrants from Central America
Paiute
Single Female Poverty
Single Female Poverty Comparison
Immigrants from Central America
Paiute
24.8%
SINGLE FEMALE POVERTY
0.0/ 100
METRIC RATING
297th/ 347
METRIC RANK
25.5%
SINGLE FEMALE POVERTY
0.0/ 100
METRIC RATING
312th/ 347
METRIC RANK
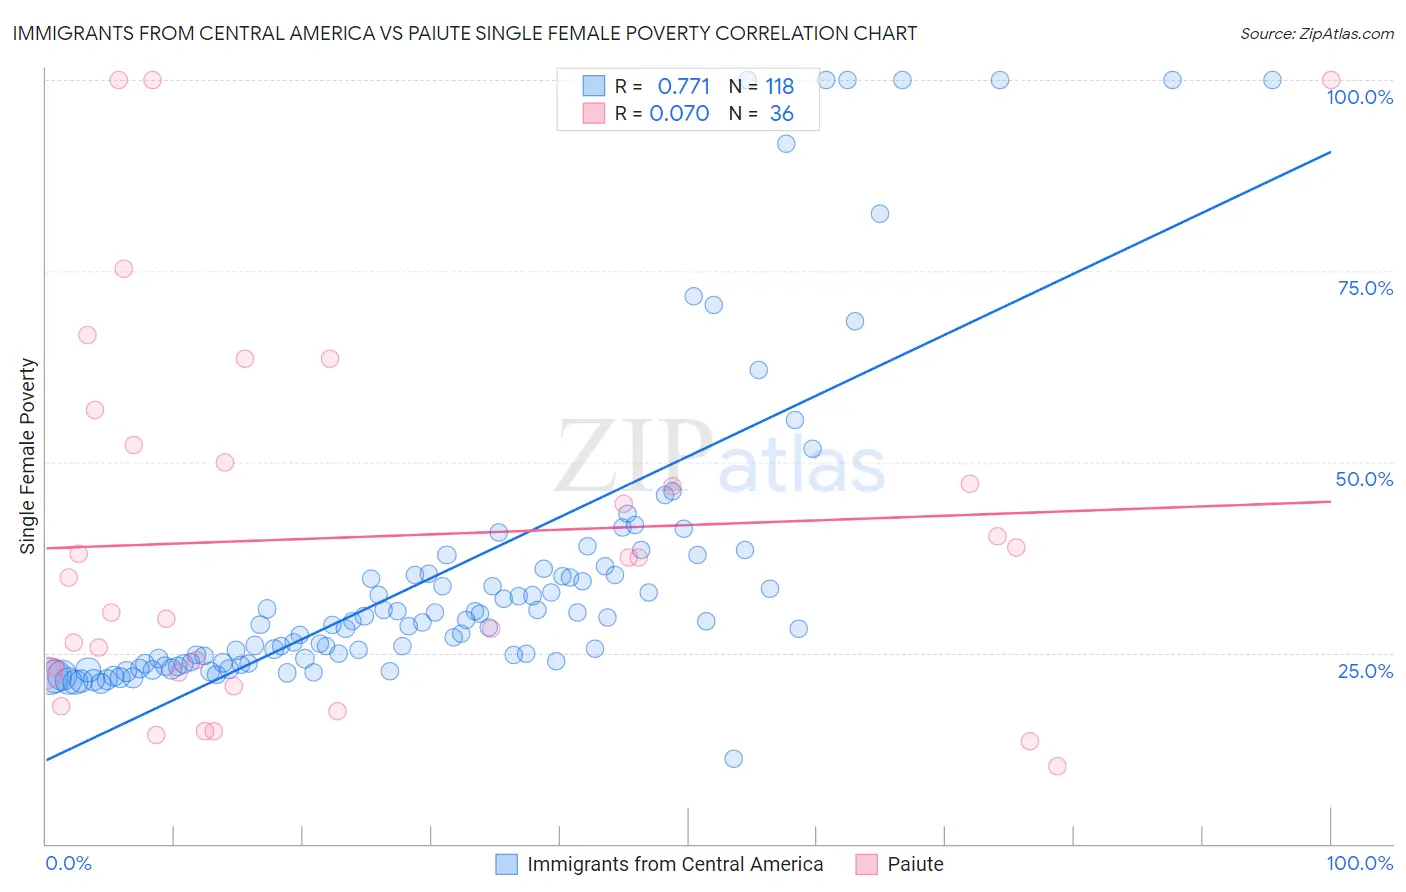
Immigrants from Central America vs Paiute Single Female Poverty Correlation Chart
The statistical analysis conducted on geographies consisting of 523,015,170 people shows a strong positive correlation between the proportion of Immigrants from Central America and poverty level among single females in the United States with a correlation coefficient (R) of 0.771 and weighted average of 24.8%. Similarly, the statistical analysis conducted on geographies consisting of 58,262,204 people shows a slight positive correlation between the proportion of Paiute and poverty level among single females in the United States with a correlation coefficient (R) of 0.070 and weighted average of 25.5%, a difference of 2.9%.
Single Female Poverty Correlation Summary
| Measurement | Immigrants from Central America | Paiute |
| Minimum | 11.1% | 10.1% |
| Maximum | 100.0% | 100.0% |
| Range | 88.9% | 89.9% |
| Mean | 35.5% | 40.2% |
| Median | 28.8% | 36.2% |
| Interquartile 25% (IQ1) | 23.6% | 22.3% |
| Interquartile 75% (IQ3) | 35.4% | 51.1% |
| Interquartile Range (IQR) | 11.8% | 28.8% |
| Standard Deviation (Sample) | 20.4% | 24.7% |
| Standard Deviation (Population) | 20.3% | 24.4% |
Demographics Similar to Immigrants from Central America and Paiute by Single Female Poverty
In terms of single female poverty, the demographic groups most similar to Immigrants from Central America are Yaqui (24.9%, a difference of 0.19%), African (24.8%, a difference of 0.28%), Hispanic or Latino (24.6%, a difference of 0.76%), Mexican (25.0%, a difference of 0.86%), and Blackfeet (25.1%, a difference of 0.94%). Similarly, the demographic groups most similar to Paiute are Immigrants from Honduras (25.5%, a difference of 0.050%), Comanche (25.6%, a difference of 0.11%), Central American Indian (25.5%, a difference of 0.33%), Cherokee (25.7%, a difference of 0.47%), and Dominican (25.4%, a difference of 0.48%).
| Demographics | Rating | Rank | Single Female Poverty |
| French American Indians | 0.0 /100 | #294 | Tragic 24.6% |
| Hispanics or Latinos | 0.0 /100 | #295 | Tragic 24.6% |
| Africans | 0.0 /100 | #296 | Tragic 24.8% |
| Immigrants | Central America | 0.0 /100 | #297 | Tragic 24.8% |
| Yaqui | 0.0 /100 | #298 | Tragic 24.9% |
| Mexicans | 0.0 /100 | #299 | Tragic 25.0% |
| Blackfeet | 0.0 /100 | #300 | Tragic 25.1% |
| Hondurans | 0.0 /100 | #301 | Tragic 25.1% |
| Shoshone | 0.0 /100 | #302 | Tragic 25.1% |
| Somalis | 0.0 /100 | #303 | Tragic 25.2% |
| Immigrants | Congo | 0.0 /100 | #304 | Tragic 25.3% |
| Immigrants | Dominican Republic | 0.0 /100 | #305 | Tragic 25.3% |
| Immigrants | Mexico | 0.0 /100 | #306 | Tragic 25.3% |
| Potawatomi | 0.0 /100 | #307 | Tragic 25.4% |
| Aleuts | 0.0 /100 | #308 | Tragic 25.4% |
| Dominicans | 0.0 /100 | #309 | Tragic 25.4% |
| Central American Indians | 0.0 /100 | #310 | Tragic 25.5% |
| Immigrants | Honduras | 0.0 /100 | #311 | Tragic 25.5% |
| Paiute | 0.0 /100 | #312 | Tragic 25.5% |
| Comanche | 0.0 /100 | #313 | Tragic 25.6% |
| Cherokee | 0.0 /100 | #314 | Tragic 25.7% |