Bulgarian vs Immigrants from Sri Lanka Hearing Disability
COMPARE
Bulgarian
Immigrants from Sri Lanka
Hearing Disability
Hearing Disability Comparison
Bulgarians
Immigrants from Sri Lanka
3.0%
HEARING DISABILITY
39.7/ 100
METRIC RATING
183rd/ 347
METRIC RANK
2.7%
HEARING DISABILITY
98.4/ 100
METRIC RATING
64th/ 347
METRIC RANK
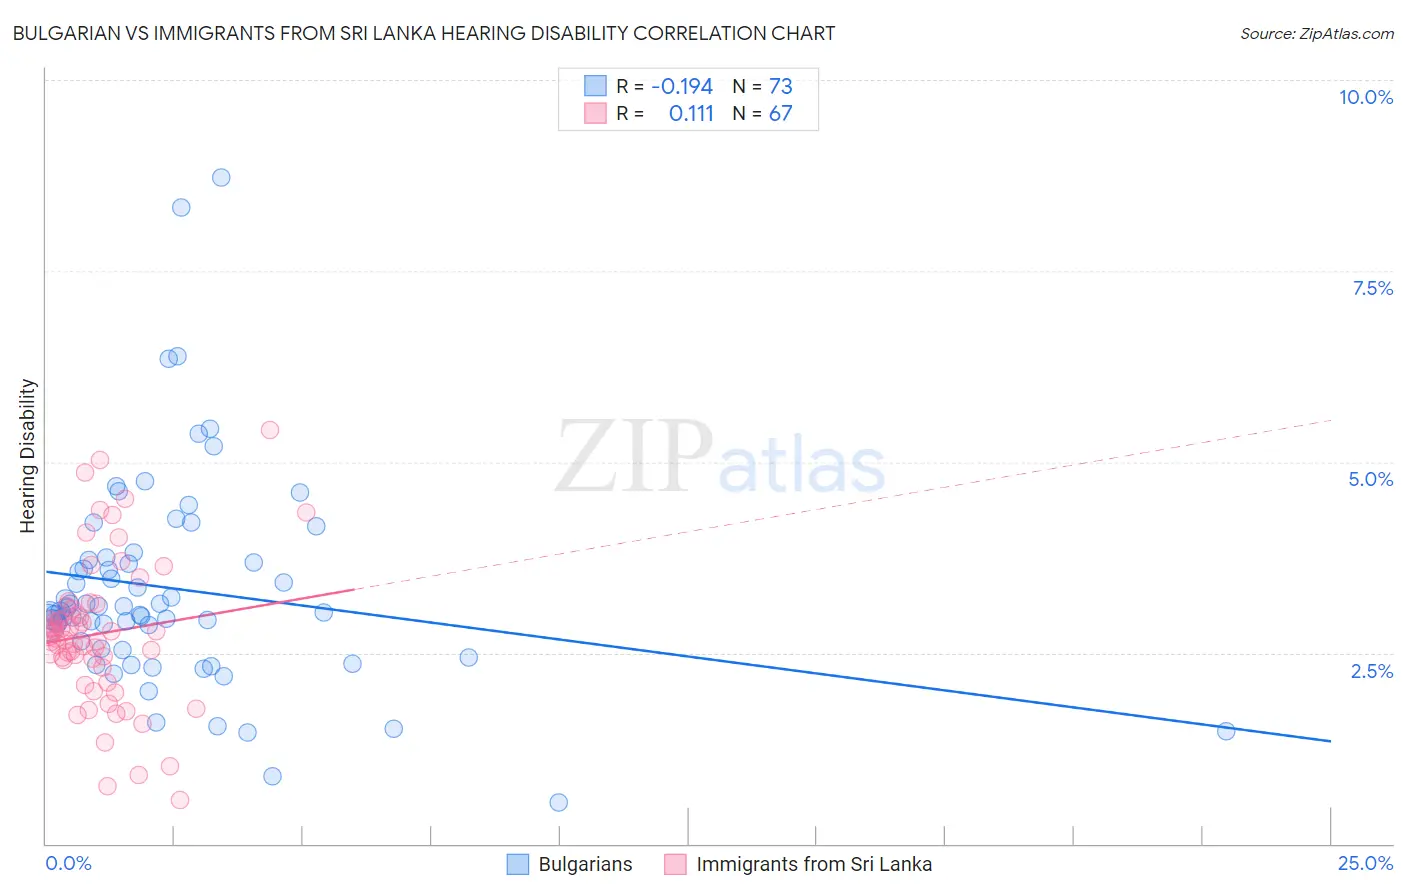
Bulgarian vs Immigrants from Sri Lanka Hearing Disability Correlation Chart
The statistical analysis conducted on geographies consisting of 205,610,417 people shows a poor negative correlation between the proportion of Bulgarians and percentage of population with hearing disability in the United States with a correlation coefficient (R) of -0.194 and weighted average of 3.0%. Similarly, the statistical analysis conducted on geographies consisting of 149,683,223 people shows a poor positive correlation between the proportion of Immigrants from Sri Lanka and percentage of population with hearing disability in the United States with a correlation coefficient (R) of 0.111 and weighted average of 2.7%, a difference of 11.7%.
Hearing Disability Correlation Summary
| Measurement | Bulgarian | Immigrants from Sri Lanka |
| Minimum | 0.54% | 0.58% |
| Maximum | 8.7% | 5.4% |
| Range | 8.2% | 4.8% |
| Mean | 3.3% | 2.8% |
| Median | 3.1% | 2.7% |
| Interquartile 25% (IQ1) | 2.5% | 2.3% |
| Interquartile 75% (IQ3) | 3.7% | 3.1% |
| Interquartile Range (IQR) | 1.2% | 0.80% |
| Standard Deviation (Sample) | 1.4% | 0.97% |
| Standard Deviation (Population) | 1.4% | 0.97% |
Similar Demographics by Hearing Disability
Demographics Similar to Bulgarians by Hearing Disability
In terms of hearing disability, the demographic groups most similar to Bulgarians are Immigrants from Italy (3.0%, a difference of 0.14%), Immigrants from Belgium (3.0%, a difference of 0.17%), Immigrants from Ireland (3.0%, a difference of 0.23%), Immigrants from Sweden (3.0%, a difference of 0.26%), and Immigrants from Moldova (3.0%, a difference of 0.32%).
| Demographics | Rating | Rank | Hearing Disability |
| Panamanians | 47.0 /100 | #176 | Average 3.0% |
| Immigrants | Philippines | 46.4 /100 | #177 | Average 3.0% |
| Japanese | 46.0 /100 | #178 | Average 3.0% |
| Immigrants | Moldova | 43.1 /100 | #179 | Average 3.0% |
| Immigrants | Sweden | 42.4 /100 | #180 | Average 3.0% |
| Immigrants | Belgium | 41.5 /100 | #181 | Average 3.0% |
| Immigrants | Italy | 41.1 /100 | #182 | Average 3.0% |
| Bulgarians | 39.7 /100 | #183 | Fair 3.0% |
| Immigrants | Ireland | 37.4 /100 | #184 | Fair 3.0% |
| Immigrants | Southern Europe | 35.3 /100 | #185 | Fair 3.0% |
| Immigrants | Mexico | 34.9 /100 | #186 | Fair 3.0% |
| Blacks/African Americans | 34.7 /100 | #187 | Fair 3.0% |
| Mexican American Indians | 34.7 /100 | #188 | Fair 3.0% |
| Africans | 32.9 /100 | #189 | Fair 3.0% |
| Immigrants | South Africa | 31.1 /100 | #190 | Fair 3.1% |
Demographics Similar to Immigrants from Sri Lanka by Hearing Disability
In terms of hearing disability, the demographic groups most similar to Immigrants from Sri Lanka are Indian (Asian) (2.7%, a difference of 0.050%), Immigrants from Nepal (2.7%, a difference of 0.080%), Immigrants from Uzbekistan (2.7%, a difference of 0.11%), Immigrants from Colombia (2.7%, a difference of 0.11%), and Immigrants from Belize (2.7%, a difference of 0.21%).
| Demographics | Rating | Rank | Hearing Disability |
| South Americans | 99.0 /100 | #57 | Exceptional 2.7% |
| Immigrants | Peru | 98.6 /100 | #58 | Exceptional 2.7% |
| Immigrants | Eritrea | 98.5 /100 | #59 | Exceptional 2.7% |
| Immigrants | Egypt | 98.5 /100 | #60 | Exceptional 2.7% |
| Immigrants | Uzbekistan | 98.4 /100 | #61 | Exceptional 2.7% |
| Immigrants | Colombia | 98.4 /100 | #62 | Exceptional 2.7% |
| Indians (Asian) | 98.4 /100 | #63 | Exceptional 2.7% |
| Immigrants | Sri Lanka | 98.4 /100 | #64 | Exceptional 2.7% |
| Immigrants | Nepal | 98.3 /100 | #65 | Exceptional 2.7% |
| Immigrants | Belize | 98.2 /100 | #66 | Exceptional 2.7% |
| Egyptians | 98.1 /100 | #67 | Exceptional 2.7% |
| Immigrants | Africa | 98.0 /100 | #68 | Exceptional 2.7% |
| Nicaraguans | 97.9 /100 | #69 | Exceptional 2.7% |
| Peruvians | 97.7 /100 | #70 | Exceptional 2.7% |
| Central Americans | 97.7 /100 | #71 | Exceptional 2.7% |