Black/African American vs Vietnamese College, 1 year or more
COMPARE
Black/African American
Vietnamese
College, 1 year or more
College, 1 year or more Comparison
Blacks/African Americans
Vietnamese
53.3%
COLLEGE, 1 YEAR OR MORE
0.0/ 100
METRIC RATING
293rd/ 347
METRIC RANK
57.0%
COLLEGE, 1 YEAR OR MORE
4.7/ 100
METRIC RATING
225th/ 347
METRIC RANK
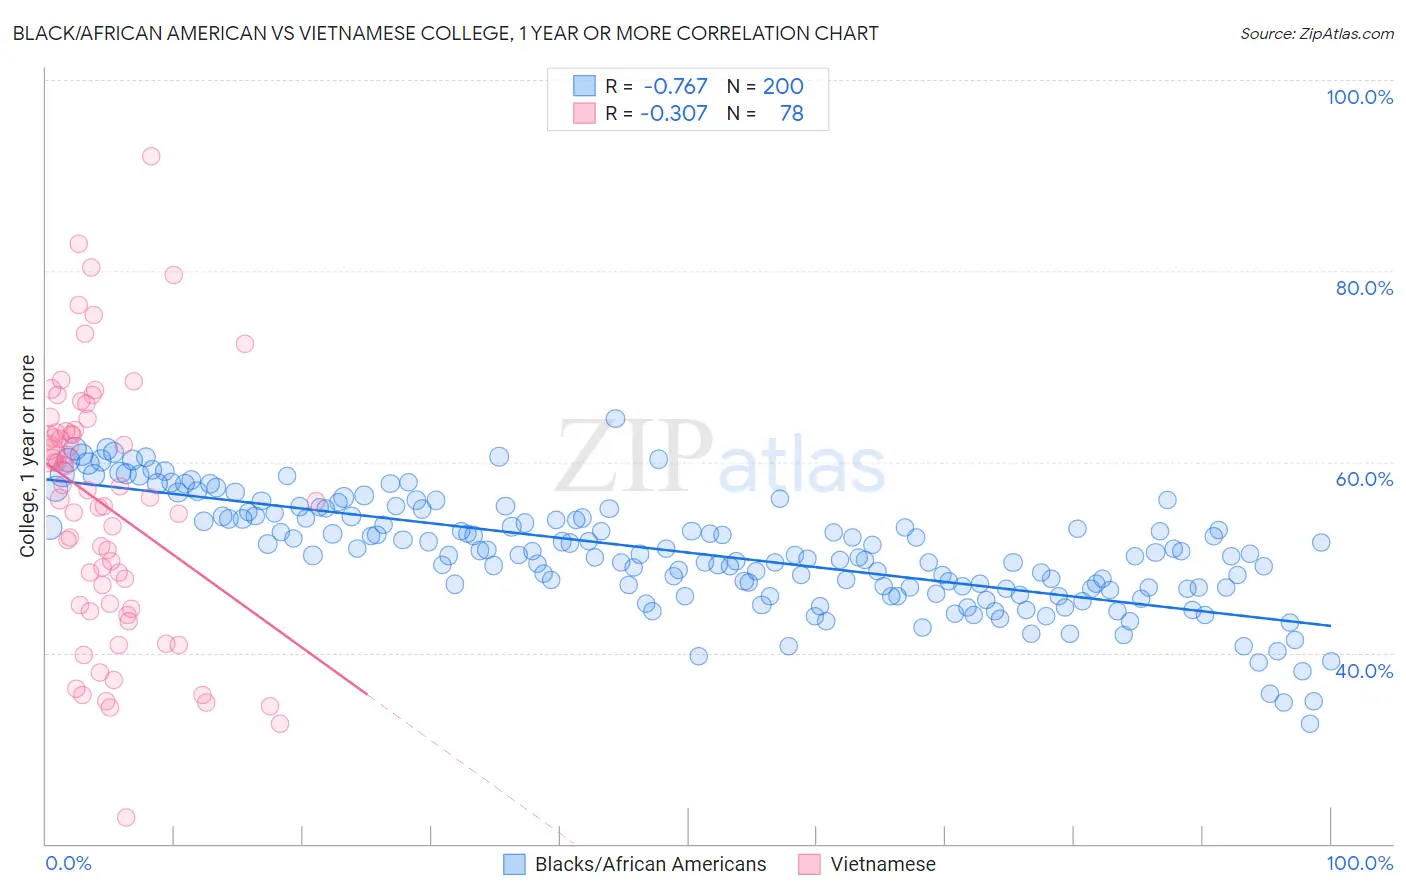
Black/African American vs Vietnamese College, 1 year or more Correlation Chart
The statistical analysis conducted on geographies consisting of 566,034,160 people shows a strong negative correlation between the proportion of Blacks/African Americans and percentage of population with at least college, 1 year or more education in the United States with a correlation coefficient (R) of -0.767 and weighted average of 53.3%. Similarly, the statistical analysis conducted on geographies consisting of 170,751,543 people shows a mild negative correlation between the proportion of Vietnamese and percentage of population with at least college, 1 year or more education in the United States with a correlation coefficient (R) of -0.307 and weighted average of 57.0%, a difference of 7.0%.
College, 1 year or more Correlation Summary
| Measurement | Black/African American | Vietnamese |
| Minimum | 32.6% | 22.8% |
| Maximum | 64.6% | 92.0% |
| Range | 32.0% | 69.3% |
| Mean | 50.5% | 55.4% |
| Median | 50.3% | 56.7% |
| Interquartile 25% (IQ1) | 46.8% | 45.0% |
| Interquartile 75% (IQ3) | 54.3% | 63.2% |
| Interquartile Range (IQR) | 7.5% | 18.3% |
| Standard Deviation (Sample) | 5.8% | 13.4% |
| Standard Deviation (Population) | 5.8% | 13.3% |
Similar Demographics by College, 1 year or more
Demographics Similar to Blacks/African Americans by College, 1 year or more
In terms of college, 1 year or more, the demographic groups most similar to Blacks/African Americans are Chickasaw (53.3%, a difference of 0.020%), Cuban (53.4%, a difference of 0.15%), Alaskan Athabascan (53.4%, a difference of 0.20%), Cherokee (53.2%, a difference of 0.21%), and Alaska Native (53.4%, a difference of 0.22%).
| Demographics | Rating | Rank | College, 1 year or more |
| Central American Indians | 0.1 /100 | #286 | Tragic 53.5% |
| Immigrants | Belize | 0.1 /100 | #287 | Tragic 53.5% |
| Alaska Natives | 0.0 /100 | #288 | Tragic 53.4% |
| Immigrants | Ecuador | 0.0 /100 | #289 | Tragic 53.4% |
| Alaskan Athabascans | 0.0 /100 | #290 | Tragic 53.4% |
| Cubans | 0.0 /100 | #291 | Tragic 53.4% |
| Chickasaw | 0.0 /100 | #292 | Tragic 53.3% |
| Blacks/African Americans | 0.0 /100 | #293 | Tragic 53.3% |
| Cherokee | 0.0 /100 | #294 | Tragic 53.2% |
| Yaqui | 0.0 /100 | #295 | Tragic 53.2% |
| Sioux | 0.0 /100 | #296 | Tragic 53.0% |
| Paiute | 0.0 /100 | #297 | Tragic 52.9% |
| Immigrants | Dominica | 0.0 /100 | #298 | Tragic 52.5% |
| Immigrants | Nicaragua | 0.0 /100 | #299 | Tragic 52.4% |
| Choctaw | 0.0 /100 | #300 | Tragic 52.3% |
Demographics Similar to Vietnamese by College, 1 year or more
In terms of college, 1 year or more, the demographic groups most similar to Vietnamese are Immigrants from Western Africa (57.0%, a difference of 0.030%), Immigrants (57.0%, a difference of 0.090%), Portuguese (57.2%, a difference of 0.21%), Hmong (57.2%, a difference of 0.21%), and Immigrants from Fiji (56.9%, a difference of 0.24%).
| Demographics | Rating | Rank | College, 1 year or more |
| Native Hawaiians | 9.0 /100 | #218 | Tragic 57.6% |
| Whites/Caucasians | 8.7 /100 | #219 | Tragic 57.6% |
| Immigrants | Costa Rica | 8.0 /100 | #220 | Tragic 57.5% |
| Immigrants | Ghana | 7.7 /100 | #221 | Tragic 57.4% |
| Sub-Saharan Africans | 6.1 /100 | #222 | Tragic 57.3% |
| Portuguese | 5.4 /100 | #223 | Tragic 57.2% |
| Hmong | 5.4 /100 | #224 | Tragic 57.2% |
| Vietnamese | 4.7 /100 | #225 | Tragic 57.0% |
| Immigrants | Western Africa | 4.6 /100 | #226 | Tragic 57.0% |
| Immigrants | Immigrants | 4.4 /100 | #227 | Tragic 57.0% |
| Immigrants | Fiji | 4.0 /100 | #228 | Tragic 56.9% |
| Cree | 3.6 /100 | #229 | Tragic 56.8% |
| Liberians | 3.1 /100 | #230 | Tragic 56.7% |
| Immigrants | Burma/Myanmar | 2.7 /100 | #231 | Tragic 56.6% |
| Immigrants | Bangladesh | 2.6 /100 | #232 | Tragic 56.6% |