Immigrants from Grenada vs Vietnamese Single Female Poverty
COMPARE
Immigrants from Grenada
Vietnamese
Single Female Poverty
Single Female Poverty Comparison
Immigrants from Grenada
Vietnamese
21.8%
SINGLE FEMALE POVERTY
8.0/ 100
METRIC RATING
221st/ 347
METRIC RANK
22.0%
SINGLE FEMALE POVERTY
4.0/ 100
METRIC RATING
237th/ 347
METRIC RANK
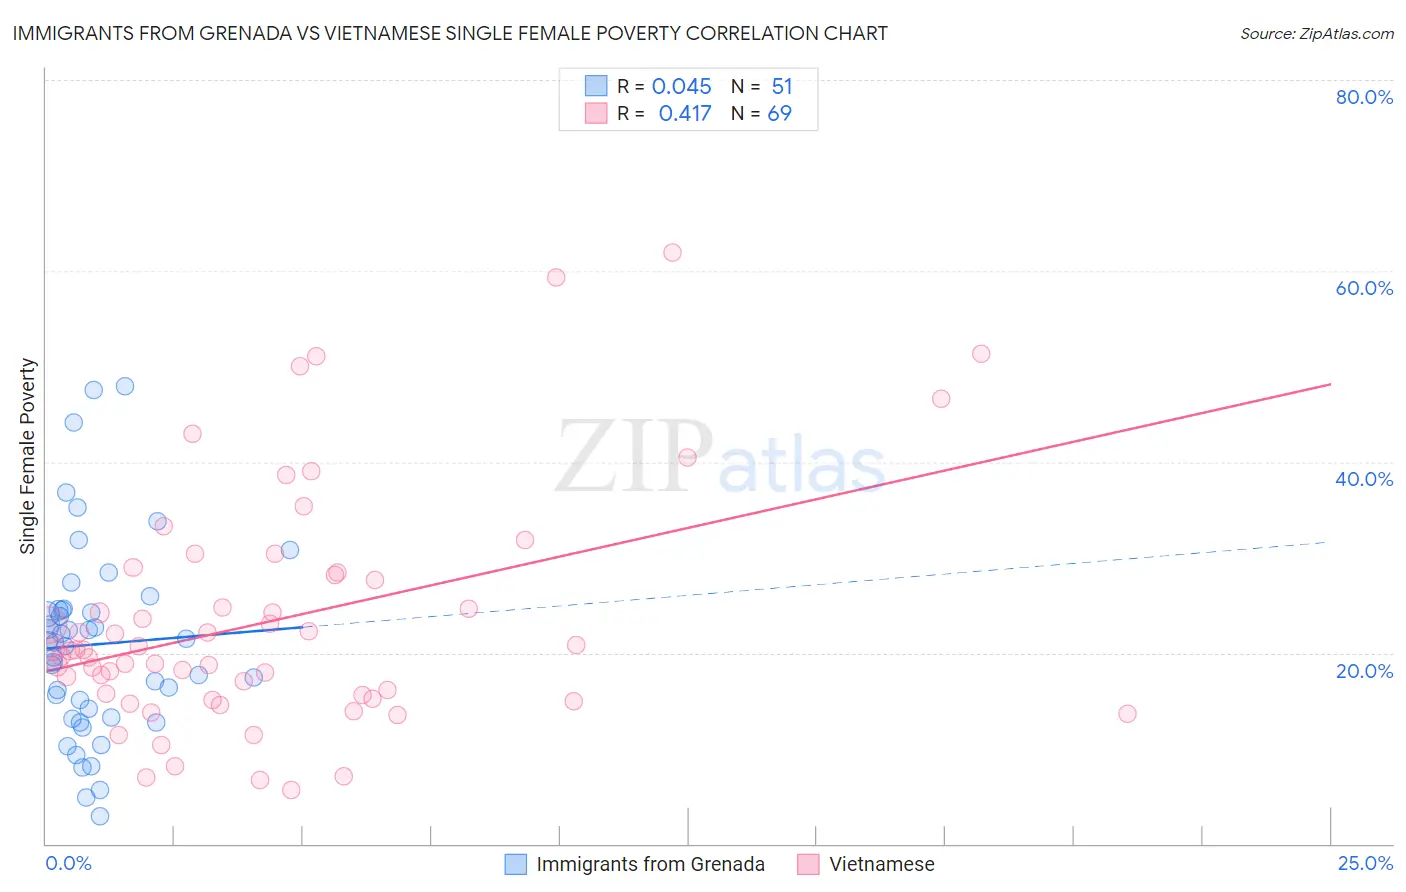
Immigrants from Grenada vs Vietnamese Single Female Poverty Correlation Chart
The statistical analysis conducted on geographies consisting of 66,935,343 people shows no correlation between the proportion of Immigrants from Grenada and poverty level among single females in the United States with a correlation coefficient (R) of 0.045 and weighted average of 21.8%. Similarly, the statistical analysis conducted on geographies consisting of 169,688,575 people shows a moderate positive correlation between the proportion of Vietnamese and poverty level among single females in the United States with a correlation coefficient (R) of 0.417 and weighted average of 22.0%, a difference of 1.1%.
Single Female Poverty Correlation Summary
| Measurement | Immigrants from Grenada | Vietnamese |
| Minimum | 2.9% | 5.6% |
| Maximum | 47.9% | 61.9% |
| Range | 45.1% | 56.4% |
| Mean | 20.9% | 23.4% |
| Median | 21.0% | 20.3% |
| Interquartile 25% (IQ1) | 13.2% | 15.4% |
| Interquartile 75% (IQ3) | 24.4% | 28.3% |
| Interquartile Range (IQR) | 11.3% | 12.9% |
| Standard Deviation (Sample) | 10.1% | 12.3% |
| Standard Deviation (Population) | 10.0% | 12.3% |
Demographics Similar to Immigrants from Grenada and Vietnamese by Single Female Poverty
In terms of single female poverty, the demographic groups most similar to Immigrants from Grenada are Immigrants from Eritrea (21.8%, a difference of 0.010%), German (21.8%, a difference of 0.050%), Scottish (21.8%, a difference of 0.15%), Barbadian (21.8%, a difference of 0.17%), and Panamanian (21.7%, a difference of 0.26%). Similarly, the demographic groups most similar to Vietnamese are Immigrants from Ecuador (22.0%, a difference of 0.070%), Dutch (22.0%, a difference of 0.23%), Spaniard (22.0%, a difference of 0.25%), Spanish (22.0%, a difference of 0.25%), and Immigrants from Thailand (22.0%, a difference of 0.35%).
| Demographics | Rating | Rank | Single Female Poverty |
| Panamanians | 9.4 /100 | #219 | Tragic 21.7% |
| Germans | 8.3 /100 | #220 | Tragic 21.8% |
| Immigrants | Grenada | 8.0 /100 | #221 | Tragic 21.8% |
| Immigrants | Eritrea | 7.9 /100 | #222 | Tragic 21.8% |
| Scottish | 7.3 /100 | #223 | Tragic 21.8% |
| Barbadians | 7.2 /100 | #224 | Tragic 21.8% |
| English | 6.4 /100 | #225 | Tragic 21.9% |
| Immigrants | Portugal | 5.8 /100 | #226 | Tragic 21.9% |
| Immigrants | Ghana | 5.8 /100 | #227 | Tragic 21.9% |
| Salvadorans | 5.5 /100 | #228 | Tragic 21.9% |
| Tlingit-Haida | 5.4 /100 | #229 | Tragic 21.9% |
| Immigrants | Western Africa | 5.3 /100 | #230 | Tragic 22.0% |
| Welsh | 5.0 /100 | #231 | Tragic 22.0% |
| Immigrants | Thailand | 5.0 /100 | #232 | Tragic 22.0% |
| Spaniards | 4.7 /100 | #233 | Tragic 22.0% |
| Spanish | 4.7 /100 | #234 | Tragic 22.0% |
| Dutch | 4.6 /100 | #235 | Tragic 22.0% |
| Immigrants | Ecuador | 4.2 /100 | #236 | Tragic 22.0% |
| Vietnamese | 4.0 /100 | #237 | Tragic 22.0% |
| French Canadians | 2.8 /100 | #238 | Tragic 22.2% |
| Malaysians | 2.8 /100 | #239 | Tragic 22.2% |