Belizean vs Sudanese Married-Couple Family Poverty
COMPARE
Belizean
Sudanese
Married-Couple Family Poverty
Married-Couple Family Poverty Comparison
Belizeans
Sudanese
6.5%
MARRIED-COUPLE FAMILY POVERTY
0.0/ 100
METRIC RATING
291st/ 347
METRIC RANK
5.6%
MARRIED-COUPLE FAMILY POVERTY
6.4/ 100
METRIC RATING
224th/ 347
METRIC RANK
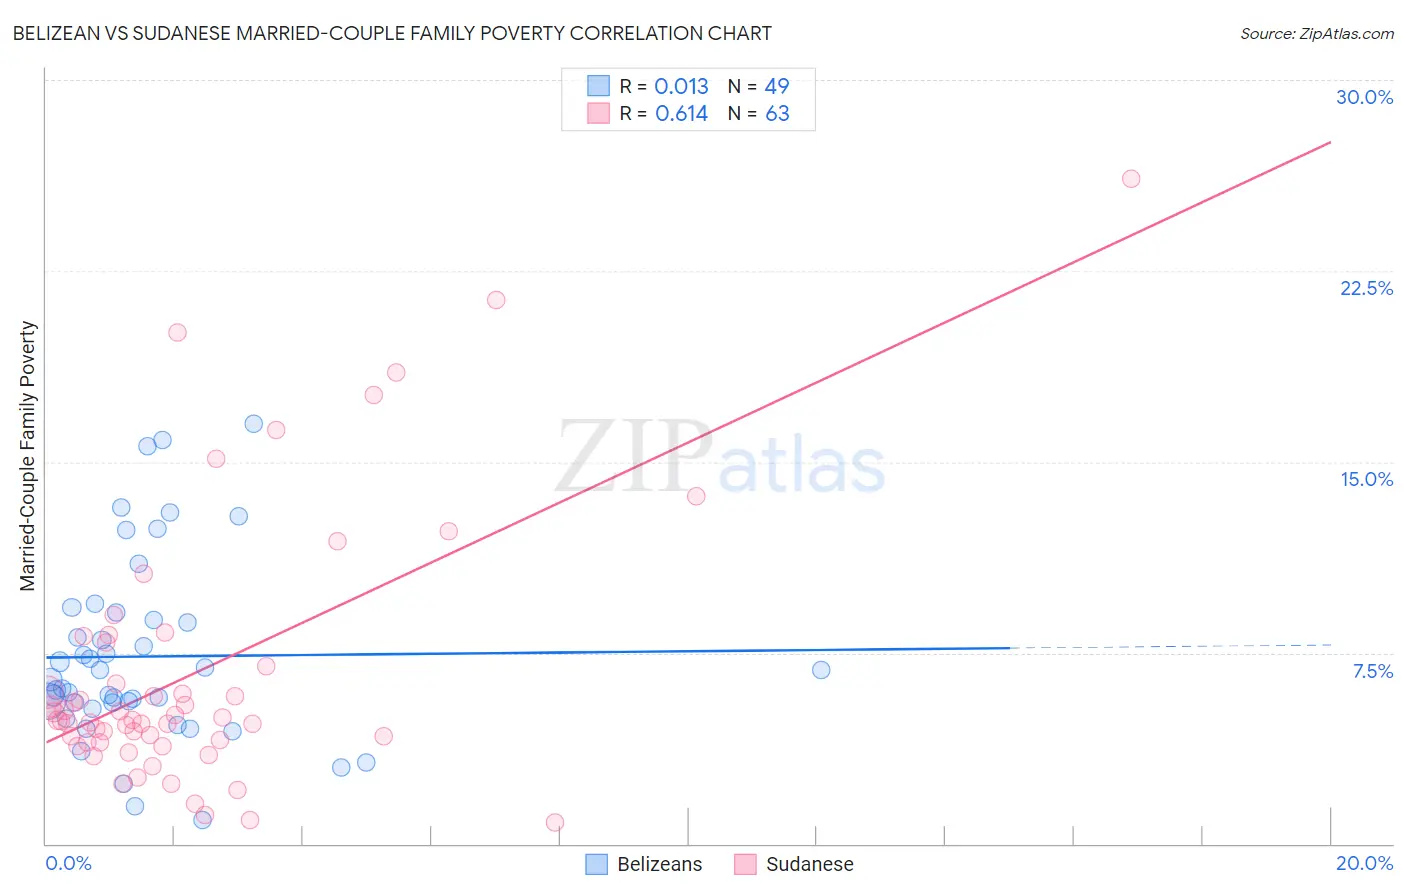
Belizean vs Sudanese Married-Couple Family Poverty Correlation Chart
The statistical analysis conducted on geographies consisting of 143,932,988 people shows no correlation between the proportion of Belizeans and poverty level among married-couple families in the United States with a correlation coefficient (R) of 0.013 and weighted average of 6.5%. Similarly, the statistical analysis conducted on geographies consisting of 109,883,961 people shows a significant positive correlation between the proportion of Sudanese and poverty level among married-couple families in the United States with a correlation coefficient (R) of 0.614 and weighted average of 5.6%, a difference of 16.5%.
Married-Couple Family Poverty Correlation Summary
| Measurement | Belizean | Sudanese |
| Minimum | 0.96% | 0.84% |
| Maximum | 16.5% | 26.1% |
| Range | 15.5% | 25.3% |
| Mean | 7.4% | 6.8% |
| Median | 6.5% | 4.9% |
| Interquartile 25% (IQ1) | 5.4% | 4.0% |
| Interquartile 75% (IQ3) | 8.9% | 7.9% |
| Interquartile Range (IQR) | 3.5% | 3.9% |
| Standard Deviation (Sample) | 3.6% | 5.2% |
| Standard Deviation (Population) | 3.6% | 5.2% |
Similar Demographics by Married-Couple Family Poverty
Demographics Similar to Belizeans by Married-Couple Family Poverty
In terms of married-couple family poverty, the demographic groups most similar to Belizeans are Immigrants from Barbados (6.5%, a difference of 0.040%), Immigrants from Lebanon (6.6%, a difference of 0.17%), Nepalese (6.5%, a difference of 0.26%), Arapaho (6.6%, a difference of 0.26%), and Salvadoran (6.5%, a difference of 0.44%).
| Demographics | Rating | Rank | Married-Couple Family Poverty |
| Dutch West Indians | 0.0 /100 | #284 | Tragic 6.4% |
| Blacks/African Americans | 0.0 /100 | #285 | Tragic 6.5% |
| Guyanese | 0.0 /100 | #286 | Tragic 6.5% |
| Ecuadorians | 0.0 /100 | #287 | Tragic 6.5% |
| Salvadorans | 0.0 /100 | #288 | Tragic 6.5% |
| Nepalese | 0.0 /100 | #289 | Tragic 6.5% |
| Immigrants | Barbados | 0.0 /100 | #290 | Tragic 6.5% |
| Belizeans | 0.0 /100 | #291 | Tragic 6.5% |
| Immigrants | Lebanon | 0.0 /100 | #292 | Tragic 6.6% |
| Arapaho | 0.0 /100 | #293 | Tragic 6.6% |
| Bahamians | 0.0 /100 | #294 | Tragic 6.6% |
| Immigrants | Uzbekistan | 0.0 /100 | #295 | Tragic 6.6% |
| U.S. Virgin Islanders | 0.0 /100 | #296 | Tragic 6.6% |
| Kiowa | 0.0 /100 | #297 | Tragic 6.6% |
| Immigrants | Guyana | 0.0 /100 | #298 | Tragic 6.7% |
Demographics Similar to Sudanese by Married-Couple Family Poverty
In terms of married-couple family poverty, the demographic groups most similar to Sudanese are Immigrants from Fiji (5.6%, a difference of 0.11%), Immigrants from Cambodia (5.6%, a difference of 0.14%), Cajun (5.6%, a difference of 0.18%), South American (5.6%, a difference of 0.37%), and Immigrants from Zaire (5.6%, a difference of 0.38%).
| Demographics | Rating | Rank | Married-Couple Family Poverty |
| Immigrants | Nigeria | 11.3 /100 | #217 | Poor 5.5% |
| Afghans | 11.2 /100 | #218 | Poor 5.5% |
| Japanese | 9.8 /100 | #219 | Tragic 5.6% |
| Colombians | 9.2 /100 | #220 | Tragic 5.6% |
| Panamanians | 9.2 /100 | #221 | Tragic 5.6% |
| Cajuns | 6.9 /100 | #222 | Tragic 5.6% |
| Immigrants | Fiji | 6.7 /100 | #223 | Tragic 5.6% |
| Sudanese | 6.4 /100 | #224 | Tragic 5.6% |
| Immigrants | Cambodia | 6.1 /100 | #225 | Tragic 5.6% |
| South Americans | 5.7 /100 | #226 | Tragic 5.6% |
| Immigrants | Zaire | 5.6 /100 | #227 | Tragic 5.6% |
| Arabs | 5.4 /100 | #228 | Tragic 5.7% |
| Sub-Saharan Africans | 4.9 /100 | #229 | Tragic 5.7% |
| Moroccans | 4.9 /100 | #230 | Tragic 5.7% |
| Immigrants | Iraq | 4.4 /100 | #231 | Tragic 5.7% |