Belizean vs Sudanese Median Household Income
COMPARE
Belizean
Sudanese
Median Household Income
Median Household Income Comparison
Belizeans
Sudanese
$77,028
MEDIAN HOUSEHOLD INCOME
0.6/ 100
METRIC RATING
256th/ 347
METRIC RANK
$78,529
MEDIAN HOUSEHOLD INCOME
1.5/ 100
METRIC RATING
248th/ 347
METRIC RANK
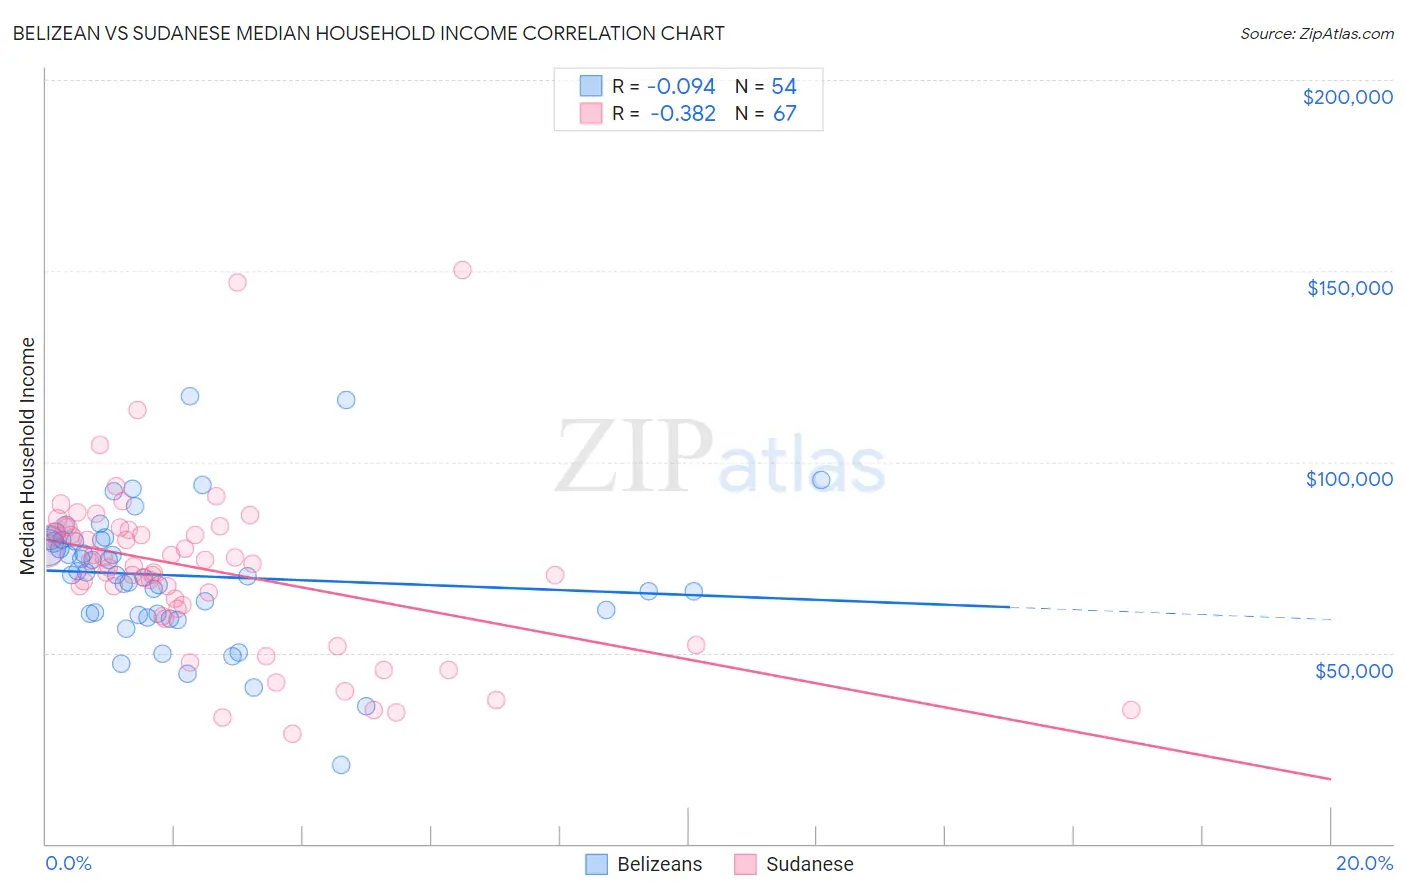
Belizean vs Sudanese Median Household Income Correlation Chart
The statistical analysis conducted on geographies consisting of 144,146,880 people shows a slight negative correlation between the proportion of Belizeans and median household income in the United States with a correlation coefficient (R) of -0.094 and weighted average of $77,028. Similarly, the statistical analysis conducted on geographies consisting of 110,096,720 people shows a mild negative correlation between the proportion of Sudanese and median household income in the United States with a correlation coefficient (R) of -0.382 and weighted average of $78,529, a difference of 1.9%.
Median Household Income Correlation Summary
| Measurement | Belizean | Sudanese |
| Minimum | $20,723 | $28,750 |
| Maximum | $117,113 | $150,237 |
| Range | $96,390 | $121,487 |
| Mean | $70,224 | $71,874 |
| Median | $70,434 | $73,369 |
| Interquartile 25% (IQ1) | $60,138 | $61,639 |
| Interquartile 75% (IQ3) | $79,527 | $82,076 |
| Interquartile Range (IQR) | $19,389 | $20,437 |
| Standard Deviation (Sample) | $17,495 | $22,253 |
| Standard Deviation (Population) | $17,332 | $22,086 |
Demographics Similar to Belizeans and Sudanese by Median Household Income
In terms of median household income, the demographic groups most similar to Belizeans are Immigrants from Senegal ($76,915, a difference of 0.15%), Immigrants from Nicaragua ($76,784, a difference of 0.32%), Spanish American Indian ($76,670, a difference of 0.47%), Jamaican ($76,583, a difference of 0.58%), and Immigrants from Grenada ($76,517, a difference of 0.67%). Similarly, the demographic groups most similar to Sudanese are West Indian ($78,455, a difference of 0.090%), Immigrants from Burma/Myanmar ($78,682, a difference of 0.19%), Immigrants from Laos ($78,327, a difference of 0.26%), Central American ($78,803, a difference of 0.35%), and Inupiat ($78,841, a difference of 0.40%).
| Demographics | Rating | Rank | Median Household Income |
| Immigrants | Sudan | 2.1 /100 | #242 | Tragic $79,103 |
| Immigrants | Barbados | 1.9 /100 | #243 | Tragic $78,989 |
| Marshallese | 1.9 /100 | #244 | Tragic $78,930 |
| Inupiat | 1.8 /100 | #245 | Tragic $78,841 |
| Central Americans | 1.7 /100 | #246 | Tragic $78,803 |
| Immigrants | Burma/Myanmar | 1.6 /100 | #247 | Tragic $78,682 |
| Sudanese | 1.5 /100 | #248 | Tragic $78,529 |
| West Indians | 1.4 /100 | #249 | Tragic $78,455 |
| Immigrants | Laos | 1.3 /100 | #250 | Tragic $78,327 |
| Mexican American Indians | 1.2 /100 | #251 | Tragic $78,166 |
| Immigrants | West Indies | 1.0 /100 | #252 | Tragic $77,956 |
| Immigrants | St. Vincent and the Grenadines | 0.9 /100 | #253 | Tragic $77,690 |
| Sub-Saharan Africans | 0.8 /100 | #254 | Tragic $77,631 |
| Immigrants | Middle Africa | 0.8 /100 | #255 | Tragic $77,559 |
| Belizeans | 0.6 /100 | #256 | Tragic $77,028 |
| Immigrants | Senegal | 0.5 /100 | #257 | Tragic $76,915 |
| Immigrants | Nicaragua | 0.5 /100 | #258 | Tragic $76,784 |
| Spanish American Indians | 0.4 /100 | #259 | Tragic $76,670 |
| Jamaicans | 0.4 /100 | #260 | Tragic $76,583 |
| Immigrants | Grenada | 0.4 /100 | #261 | Tragic $76,517 |
| French American Indians | 0.4 /100 | #262 | Tragic $76,387 |