Barbadian vs Czechoslovakian Single Mother Poverty
COMPARE
Barbadian
Czechoslovakian
Single Mother Poverty
Single Mother Poverty Comparison
Barbadians
Czechoslovakians
30.7%
SINGLE MOTHER POVERTY
1.3/ 100
METRIC RATING
245th/ 347
METRIC RANK
29.7%
SINGLE MOTHER POVERTY
16.1/ 100
METRIC RATING
205th/ 347
METRIC RANK
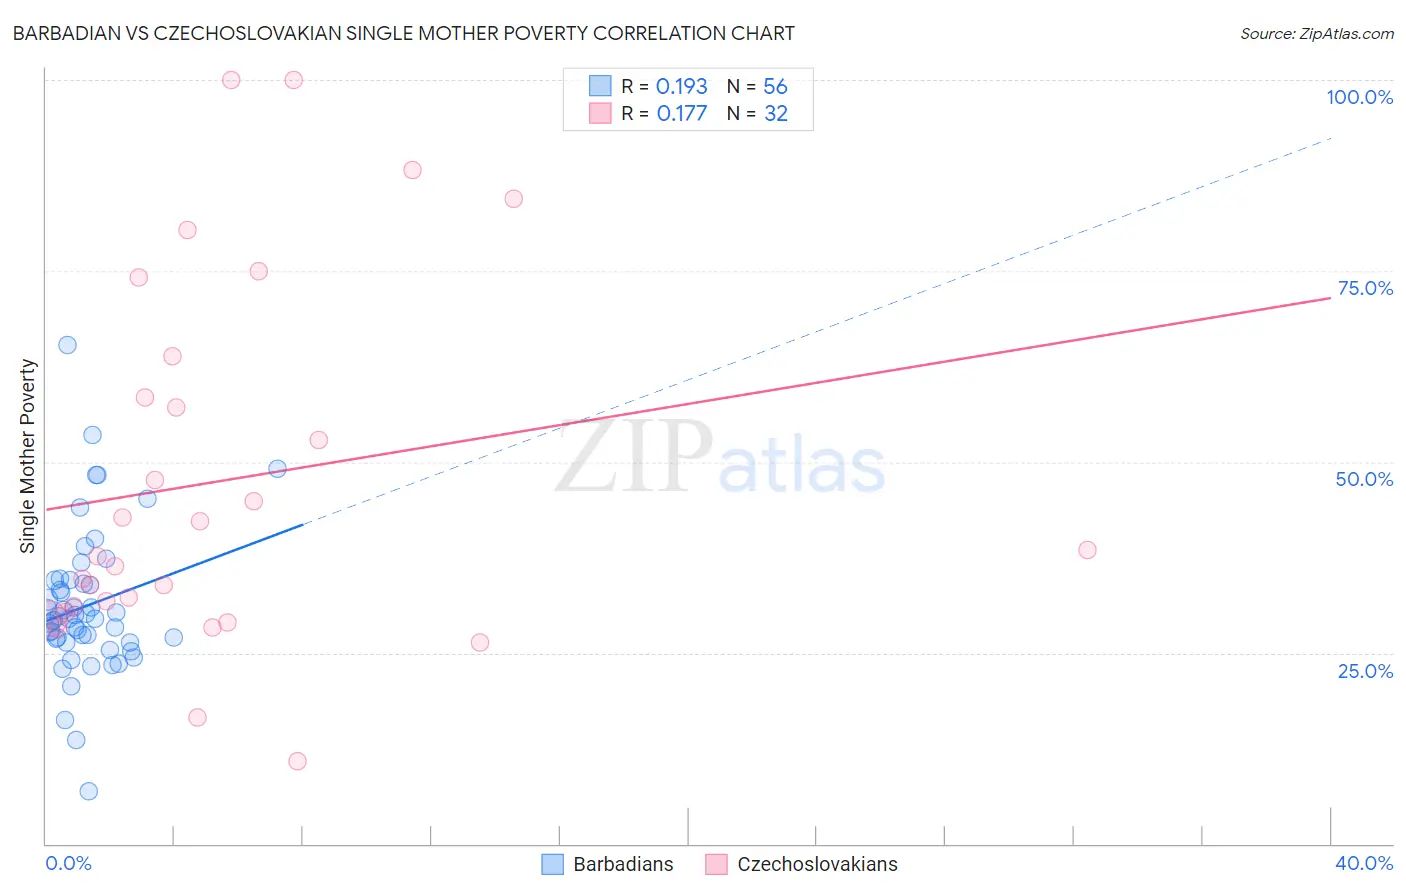
Barbadian vs Czechoslovakian Single Mother Poverty Correlation Chart
The statistical analysis conducted on geographies consisting of 140,210,705 people shows a poor positive correlation between the proportion of Barbadians and poverty level among single mothers in the United States with a correlation coefficient (R) of 0.193 and weighted average of 30.7%. Similarly, the statistical analysis conducted on geographies consisting of 358,570,470 people shows a poor positive correlation between the proportion of Czechoslovakians and poverty level among single mothers in the United States with a correlation coefficient (R) of 0.177 and weighted average of 29.7%, a difference of 3.1%.
Single Mother Poverty Correlation Summary
| Measurement | Barbadian | Czechoslovakian |
| Minimum | 6.9% | 10.8% |
| Maximum | 65.3% | 100.0% |
| Range | 58.4% | 89.2% |
| Mean | 31.1% | 47.5% |
| Median | 29.4% | 38.1% |
| Interquartile 25% (IQ1) | 26.6% | 30.7% |
| Interquartile 75% (IQ3) | 34.3% | 61.2% |
| Interquartile Range (IQR) | 7.6% | 30.4% |
| Standard Deviation (Sample) | 9.6% | 23.9% |
| Standard Deviation (Population) | 9.5% | 23.5% |
Similar Demographics by Single Mother Poverty
Demographics Similar to Barbadians by Single Mother Poverty
In terms of single mother poverty, the demographic groups most similar to Barbadians are French (30.7%, a difference of 0.010%), Bermudan (30.6%, a difference of 0.23%), Immigrants from Burma/Myanmar (30.6%, a difference of 0.31%), Immigrants from Laos (30.6%, a difference of 0.33%), and Salvadoran (30.6%, a difference of 0.38%).
| Demographics | Rating | Rank | Single Mother Poverty |
| Slovaks | 2.8 /100 | #238 | Tragic 30.4% |
| Immigrants | Portugal | 2.1 /100 | #239 | Tragic 30.5% |
| Salvadorans | 1.8 /100 | #240 | Tragic 30.6% |
| Immigrants | Laos | 1.8 /100 | #241 | Tragic 30.6% |
| Immigrants | Burma/Myanmar | 1.7 /100 | #242 | Tragic 30.6% |
| Bermudans | 1.6 /100 | #243 | Tragic 30.6% |
| French | 1.3 /100 | #244 | Tragic 30.7% |
| Barbadians | 1.3 /100 | #245 | Tragic 30.7% |
| Ecuadorians | 0.9 /100 | #246 | Tragic 30.8% |
| West Indians | 0.9 /100 | #247 | Tragic 30.8% |
| French Canadians | 0.9 /100 | #248 | Tragic 30.8% |
| Cape Verdeans | 0.8 /100 | #249 | Tragic 30.8% |
| Vietnamese | 0.7 /100 | #250 | Tragic 30.9% |
| Tlingit-Haida | 0.6 /100 | #251 | Tragic 30.9% |
| Alaska Natives | 0.6 /100 | #252 | Tragic 30.9% |
Demographics Similar to Czechoslovakians by Single Mother Poverty
In terms of single mother poverty, the demographic groups most similar to Czechoslovakians are Immigrants from Haiti (29.7%, a difference of 0.020%), Immigrants (29.7%, a difference of 0.040%), Immigrants from Panama (29.8%, a difference of 0.050%), Swiss (29.7%, a difference of 0.10%), and Malaysian (29.7%, a difference of 0.11%).
| Demographics | Rating | Rank | Single Mother Poverty |
| Trinidadians and Tobagonians | 21.7 /100 | #198 | Fair 29.6% |
| Cubans | 20.8 /100 | #199 | Fair 29.6% |
| Panamanians | 20.0 /100 | #200 | Fair 29.6% |
| Belgians | 18.8 /100 | #201 | Poor 29.7% |
| Malaysians | 17.4 /100 | #202 | Poor 29.7% |
| Swiss | 17.2 /100 | #203 | Poor 29.7% |
| Immigrants | Immigrants | 16.6 /100 | #204 | Poor 29.7% |
| Czechoslovakians | 16.1 /100 | #205 | Poor 29.7% |
| Immigrants | Haiti | 15.8 /100 | #206 | Poor 29.7% |
| Immigrants | Panama | 15.5 /100 | #207 | Poor 29.8% |
| Immigrants | Guyana | 14.7 /100 | #208 | Poor 29.8% |
| Irish | 13.9 /100 | #209 | Poor 29.8% |
| Haitians | 13.3 /100 | #210 | Poor 29.8% |
| Guyanese | 12.8 /100 | #211 | Poor 29.8% |
| Nicaraguans | 12.4 /100 | #212 | Poor 29.8% |