Barbadian vs Immigrants from Uruguay Single Mother Poverty
COMPARE
Barbadian
Immigrants from Uruguay
Single Mother Poverty
Single Mother Poverty Comparison
Barbadians
Immigrants from Uruguay
30.7%
SINGLE MOTHER POVERTY
1.3/ 100
METRIC RATING
245th/ 347
METRIC RANK
29.1%
SINGLE MOTHER POVERTY
57.2/ 100
METRIC RATING
169th/ 347
METRIC RANK
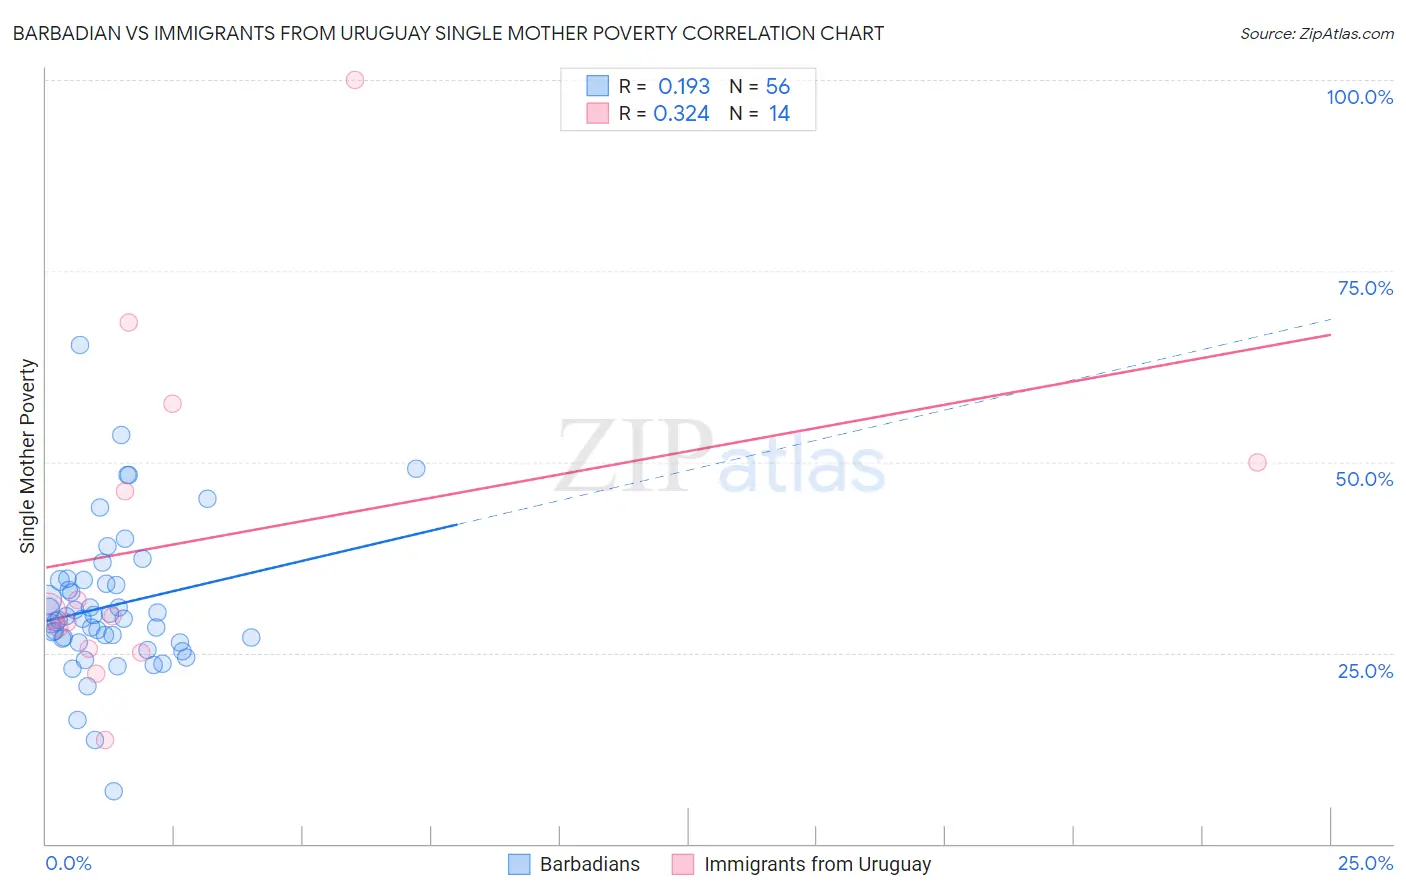
Barbadian vs Immigrants from Uruguay Single Mother Poverty Correlation Chart
The statistical analysis conducted on geographies consisting of 140,210,705 people shows a poor positive correlation between the proportion of Barbadians and poverty level among single mothers in the United States with a correlation coefficient (R) of 0.193 and weighted average of 30.7%. Similarly, the statistical analysis conducted on geographies consisting of 131,793,407 people shows a mild positive correlation between the proportion of Immigrants from Uruguay and poverty level among single mothers in the United States with a correlation coefficient (R) of 0.324 and weighted average of 29.1%, a difference of 5.5%.
Single Mother Poverty Correlation Summary
| Measurement | Barbadian | Immigrants from Uruguay |
| Minimum | 6.9% | 13.7% |
| Maximum | 65.3% | 100.0% |
| Range | 58.4% | 86.3% |
| Mean | 31.1% | 39.9% |
| Median | 29.4% | 30.1% |
| Interquartile 25% (IQ1) | 26.6% | 25.6% |
| Interquartile 75% (IQ3) | 34.3% | 50.0% |
| Interquartile Range (IQR) | 7.6% | 24.4% |
| Standard Deviation (Sample) | 9.6% | 22.9% |
| Standard Deviation (Population) | 9.5% | 22.1% |
Similar Demographics by Single Mother Poverty
Demographics Similar to Barbadians by Single Mother Poverty
In terms of single mother poverty, the demographic groups most similar to Barbadians are French (30.7%, a difference of 0.010%), Bermudan (30.6%, a difference of 0.23%), Immigrants from Burma/Myanmar (30.6%, a difference of 0.31%), Immigrants from Laos (30.6%, a difference of 0.33%), and Salvadoran (30.6%, a difference of 0.38%).
| Demographics | Rating | Rank | Single Mother Poverty |
| Slovaks | 2.8 /100 | #238 | Tragic 30.4% |
| Immigrants | Portugal | 2.1 /100 | #239 | Tragic 30.5% |
| Salvadorans | 1.8 /100 | #240 | Tragic 30.6% |
| Immigrants | Laos | 1.8 /100 | #241 | Tragic 30.6% |
| Immigrants | Burma/Myanmar | 1.7 /100 | #242 | Tragic 30.6% |
| Bermudans | 1.6 /100 | #243 | Tragic 30.6% |
| French | 1.3 /100 | #244 | Tragic 30.7% |
| Barbadians | 1.3 /100 | #245 | Tragic 30.7% |
| Ecuadorians | 0.9 /100 | #246 | Tragic 30.8% |
| West Indians | 0.9 /100 | #247 | Tragic 30.8% |
| French Canadians | 0.9 /100 | #248 | Tragic 30.8% |
| Cape Verdeans | 0.8 /100 | #249 | Tragic 30.8% |
| Vietnamese | 0.7 /100 | #250 | Tragic 30.9% |
| Tlingit-Haida | 0.6 /100 | #251 | Tragic 30.9% |
| Alaska Natives | 0.6 /100 | #252 | Tragic 30.9% |
Demographics Similar to Immigrants from Uruguay by Single Mother Poverty
In terms of single mother poverty, the demographic groups most similar to Immigrants from Uruguay are European (29.1%, a difference of 0.020%), Costa Rican (29.0%, a difference of 0.060%), New Zealander (29.1%, a difference of 0.10%), Puget Sound Salish (29.1%, a difference of 0.11%), and Inupiat (29.0%, a difference of 0.16%).
| Demographics | Rating | Rank | Single Mother Poverty |
| Scandinavians | 66.2 /100 | #162 | Good 28.9% |
| Immigrants | Nigeria | 65.9 /100 | #163 | Good 28.9% |
| Immigrants | Kenya | 65.9 /100 | #164 | Good 28.9% |
| Arabs | 60.7 /100 | #165 | Good 29.0% |
| Inupiat | 60.4 /100 | #166 | Good 29.0% |
| Costa Ricans | 58.4 /100 | #167 | Average 29.0% |
| Europeans | 57.6 /100 | #168 | Average 29.1% |
| Immigrants | Uruguay | 57.2 /100 | #169 | Average 29.1% |
| New Zealanders | 55.1 /100 | #170 | Average 29.1% |
| Puget Sound Salish | 55.1 /100 | #171 | Average 29.1% |
| Carpatho Rusyns | 53.8 /100 | #172 | Average 29.1% |
| British | 50.6 /100 | #173 | Average 29.2% |
| Immigrants | Saudi Arabia | 50.0 /100 | #174 | Average 29.2% |
| Immigrants | Costa Rica | 48.8 /100 | #175 | Average 29.2% |
| Hawaiians | 47.8 /100 | #176 | Average 29.2% |