Barbadian vs Immigrants from Congo Single Mother Poverty
COMPARE
Barbadian
Immigrants from Congo
Single Mother Poverty
Single Mother Poverty Comparison
Barbadians
Immigrants from Congo
30.7%
SINGLE MOTHER POVERTY
1.3/ 100
METRIC RATING
245th/ 347
METRIC RANK
33.8%
SINGLE MOTHER POVERTY
0.0/ 100
METRIC RATING
306th/ 347
METRIC RANK
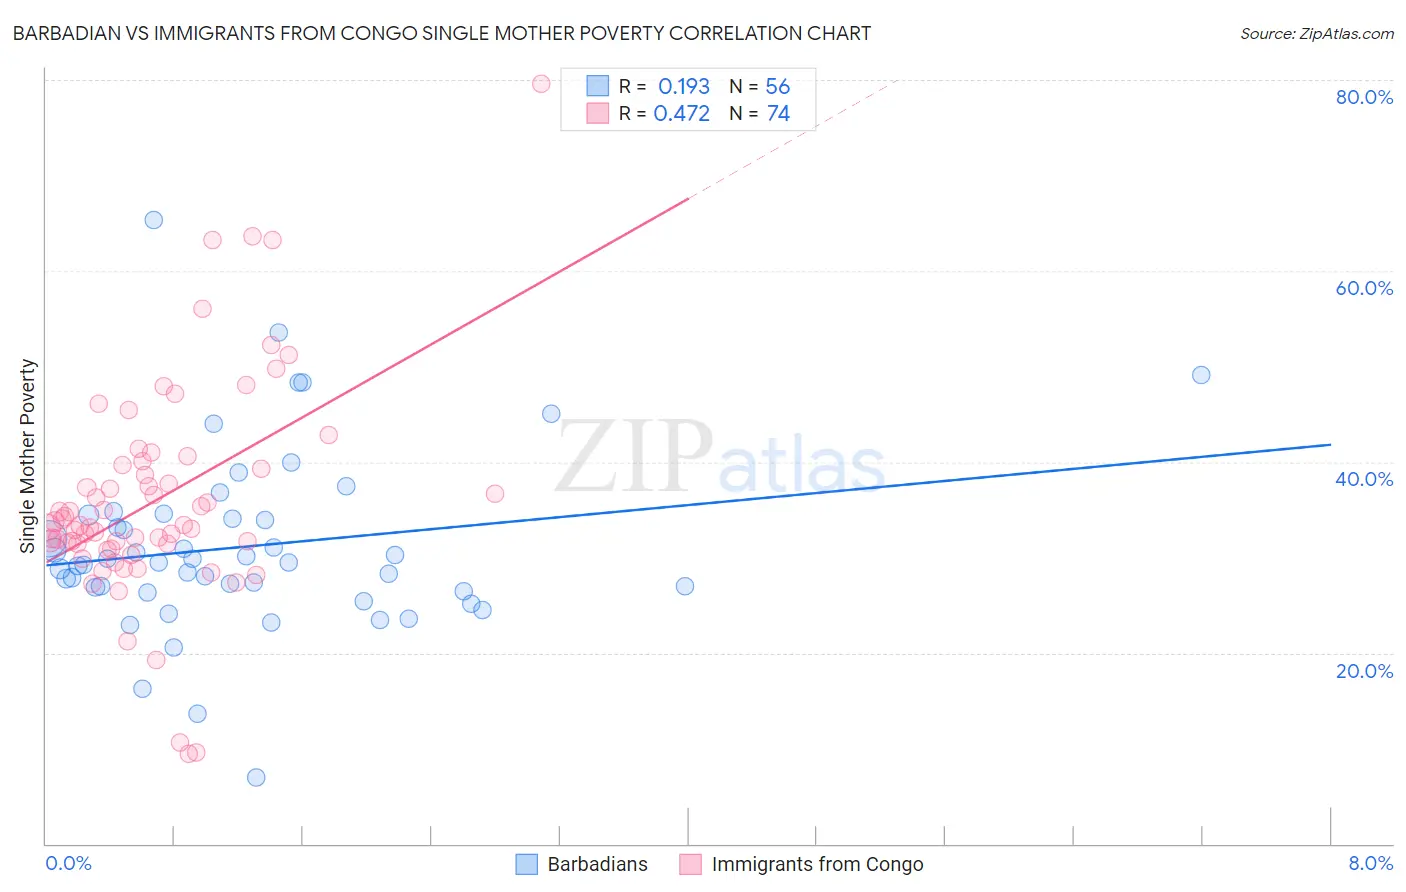
Barbadian vs Immigrants from Congo Single Mother Poverty Correlation Chart
The statistical analysis conducted on geographies consisting of 140,210,705 people shows a poor positive correlation between the proportion of Barbadians and poverty level among single mothers in the United States with a correlation coefficient (R) of 0.193 and weighted average of 30.7%. Similarly, the statistical analysis conducted on geographies consisting of 91,894,688 people shows a moderate positive correlation between the proportion of Immigrants from Congo and poverty level among single mothers in the United States with a correlation coefficient (R) of 0.472 and weighted average of 33.8%, a difference of 10.2%.
Single Mother Poverty Correlation Summary
| Measurement | Barbadian | Immigrants from Congo |
| Minimum | 6.9% | 9.4% |
| Maximum | 65.3% | 79.6% |
| Range | 58.4% | 70.2% |
| Mean | 31.1% | 36.0% |
| Median | 29.4% | 33.4% |
| Interquartile 25% (IQ1) | 26.6% | 31.4% |
| Interquartile 75% (IQ3) | 34.3% | 39.7% |
| Interquartile Range (IQR) | 7.6% | 8.3% |
| Standard Deviation (Sample) | 9.6% | 11.4% |
| Standard Deviation (Population) | 9.5% | 11.4% |
Similar Demographics by Single Mother Poverty
Demographics Similar to Barbadians by Single Mother Poverty
In terms of single mother poverty, the demographic groups most similar to Barbadians are French (30.7%, a difference of 0.010%), Bermudan (30.6%, a difference of 0.23%), Immigrants from Burma/Myanmar (30.6%, a difference of 0.31%), Immigrants from Laos (30.6%, a difference of 0.33%), and Salvadoran (30.6%, a difference of 0.38%).
| Demographics | Rating | Rank | Single Mother Poverty |
| Slovaks | 2.8 /100 | #238 | Tragic 30.4% |
| Immigrants | Portugal | 2.1 /100 | #239 | Tragic 30.5% |
| Salvadorans | 1.8 /100 | #240 | Tragic 30.6% |
| Immigrants | Laos | 1.8 /100 | #241 | Tragic 30.6% |
| Immigrants | Burma/Myanmar | 1.7 /100 | #242 | Tragic 30.6% |
| Bermudans | 1.6 /100 | #243 | Tragic 30.6% |
| French | 1.3 /100 | #244 | Tragic 30.7% |
| Barbadians | 1.3 /100 | #245 | Tragic 30.7% |
| Ecuadorians | 0.9 /100 | #246 | Tragic 30.8% |
| West Indians | 0.9 /100 | #247 | Tragic 30.8% |
| French Canadians | 0.9 /100 | #248 | Tragic 30.8% |
| Cape Verdeans | 0.8 /100 | #249 | Tragic 30.8% |
| Vietnamese | 0.7 /100 | #250 | Tragic 30.9% |
| Tlingit-Haida | 0.6 /100 | #251 | Tragic 30.9% |
| Alaska Natives | 0.6 /100 | #252 | Tragic 30.9% |
Demographics Similar to Immigrants from Congo by Single Mother Poverty
In terms of single mother poverty, the demographic groups most similar to Immigrants from Congo are Comanche (33.9%, a difference of 0.41%), Immigrants from Mexico (34.0%, a difference of 0.60%), Immigrants from Central America (33.6%, a difference of 0.64%), Mexican (33.6%, a difference of 0.68%), and American (33.5%, a difference of 0.78%).
| Demographics | Rating | Rank | Single Mother Poverty |
| Immigrants | Guatemala | 0.0 /100 | #299 | Tragic 33.3% |
| Hispanics or Latinos | 0.0 /100 | #300 | Tragic 33.3% |
| Immigrants | Somalia | 0.0 /100 | #301 | Tragic 33.4% |
| Arapaho | 0.0 /100 | #302 | Tragic 33.4% |
| Americans | 0.0 /100 | #303 | Tragic 33.5% |
| Mexicans | 0.0 /100 | #304 | Tragic 33.6% |
| Immigrants | Central America | 0.0 /100 | #305 | Tragic 33.6% |
| Immigrants | Congo | 0.0 /100 | #306 | Tragic 33.8% |
| Comanche | 0.0 /100 | #307 | Tragic 33.9% |
| Immigrants | Mexico | 0.0 /100 | #308 | Tragic 34.0% |
| Potawatomi | 0.0 /100 | #309 | Tragic 34.1% |
| Hondurans | 0.0 /100 | #310 | Tragic 34.2% |
| Alsatians | 0.0 /100 | #311 | Tragic 34.3% |
| Central American Indians | 0.0 /100 | #312 | Tragic 34.3% |
| Immigrants | Dominican Republic | 0.0 /100 | #313 | Tragic 34.4% |