Barbadian vs Immigrants from Norway Single Mother Poverty
COMPARE
Barbadian
Immigrants from Norway
Single Mother Poverty
Single Mother Poverty Comparison
Barbadians
Immigrants from Norway
30.7%
SINGLE MOTHER POVERTY
1.3/ 100
METRIC RATING
245th/ 347
METRIC RANK
29.3%
SINGLE MOTHER POVERTY
41.5/ 100
METRIC RATING
180th/ 347
METRIC RANK
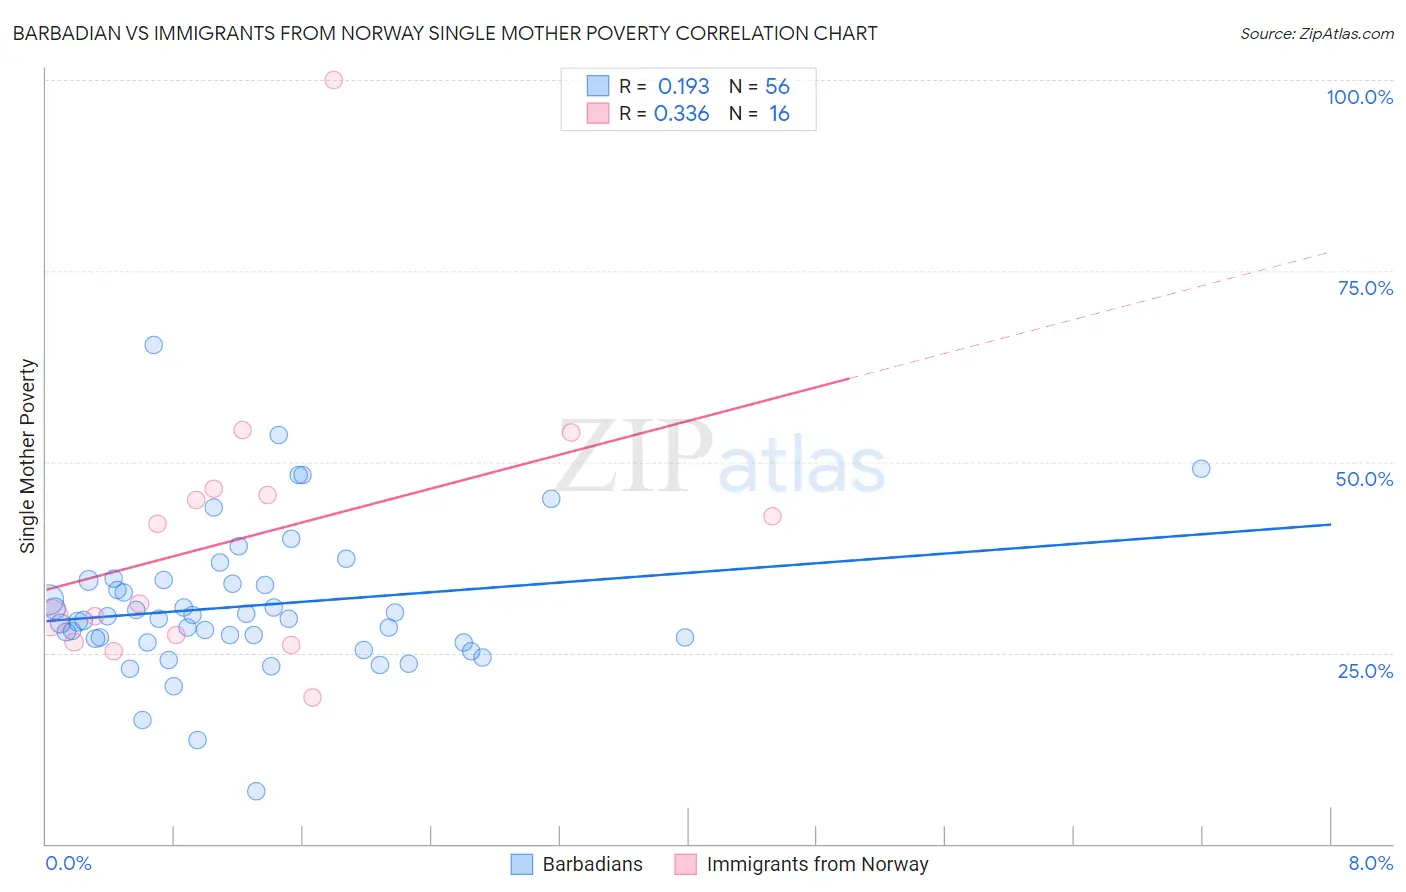
Barbadian vs Immigrants from Norway Single Mother Poverty Correlation Chart
The statistical analysis conducted on geographies consisting of 140,210,705 people shows a poor positive correlation between the proportion of Barbadians and poverty level among single mothers in the United States with a correlation coefficient (R) of 0.193 and weighted average of 30.7%. Similarly, the statistical analysis conducted on geographies consisting of 115,092,728 people shows a mild positive correlation between the proportion of Immigrants from Norway and poverty level among single mothers in the United States with a correlation coefficient (R) of 0.336 and weighted average of 29.3%, a difference of 4.7%.
Single Mother Poverty Correlation Summary
| Measurement | Barbadian | Immigrants from Norway |
| Minimum | 6.9% | 19.1% |
| Maximum | 65.3% | 100.0% |
| Range | 58.4% | 80.9% |
| Mean | 31.1% | 40.3% |
| Median | 29.4% | 36.6% |
| Interquartile 25% (IQ1) | 26.6% | 26.8% |
| Interquartile 75% (IQ3) | 34.3% | 46.1% |
| Interquartile Range (IQR) | 7.6% | 19.3% |
| Standard Deviation (Sample) | 9.6% | 19.3% |
| Standard Deviation (Population) | 9.5% | 18.7% |
Similar Demographics by Single Mother Poverty
Demographics Similar to Barbadians by Single Mother Poverty
In terms of single mother poverty, the demographic groups most similar to Barbadians are French (30.7%, a difference of 0.010%), Bermudan (30.6%, a difference of 0.23%), Immigrants from Burma/Myanmar (30.6%, a difference of 0.31%), Immigrants from Laos (30.6%, a difference of 0.33%), and Salvadoran (30.6%, a difference of 0.38%).
| Demographics | Rating | Rank | Single Mother Poverty |
| Slovaks | 2.8 /100 | #238 | Tragic 30.4% |
| Immigrants | Portugal | 2.1 /100 | #239 | Tragic 30.5% |
| Salvadorans | 1.8 /100 | #240 | Tragic 30.6% |
| Immigrants | Laos | 1.8 /100 | #241 | Tragic 30.6% |
| Immigrants | Burma/Myanmar | 1.7 /100 | #242 | Tragic 30.6% |
| Bermudans | 1.6 /100 | #243 | Tragic 30.6% |
| French | 1.3 /100 | #244 | Tragic 30.7% |
| Barbadians | 1.3 /100 | #245 | Tragic 30.7% |
| Ecuadorians | 0.9 /100 | #246 | Tragic 30.8% |
| West Indians | 0.9 /100 | #247 | Tragic 30.8% |
| French Canadians | 0.9 /100 | #248 | Tragic 30.8% |
| Cape Verdeans | 0.8 /100 | #249 | Tragic 30.8% |
| Vietnamese | 0.7 /100 | #250 | Tragic 30.9% |
| Tlingit-Haida | 0.6 /100 | #251 | Tragic 30.9% |
| Alaska Natives | 0.6 /100 | #252 | Tragic 30.9% |
Demographics Similar to Immigrants from Norway by Single Mother Poverty
In terms of single mother poverty, the demographic groups most similar to Immigrants from Norway are Immigrants from Uzbekistan (29.3%, a difference of 0.050%), Canadian (29.3%, a difference of 0.060%), South American Indian (29.3%, a difference of 0.090%), Immigrants from Eastern Africa (29.3%, a difference of 0.15%), and Nepalese (29.3%, a difference of 0.16%).
| Demographics | Rating | Rank | Single Mother Poverty |
| British | 50.6 /100 | #173 | Average 29.2% |
| Immigrants | Saudi Arabia | 50.0 /100 | #174 | Average 29.2% |
| Immigrants | Costa Rica | 48.8 /100 | #175 | Average 29.2% |
| Hawaiians | 47.8 /100 | #176 | Average 29.2% |
| Immigrants | Bosnia and Herzegovina | 45.1 /100 | #177 | Average 29.2% |
| South American Indians | 43.2 /100 | #178 | Average 29.3% |
| Immigrants | Uzbekistan | 42.6 /100 | #179 | Average 29.3% |
| Immigrants | Norway | 41.5 /100 | #180 | Average 29.3% |
| Canadians | 40.4 /100 | #181 | Average 29.3% |
| Immigrants | Eastern Africa | 38.5 /100 | #182 | Fair 29.3% |
| Nepalese | 38.3 /100 | #183 | Fair 29.3% |
| Nigerians | 38.0 /100 | #184 | Fair 29.3% |
| Ghanaians | 36.8 /100 | #185 | Fair 29.4% |
| Yugoslavians | 36.0 /100 | #186 | Fair 29.4% |
| Lebanese | 32.5 /100 | #187 | Fair 29.4% |