Barbadian vs Albanian Single Mother Poverty
COMPARE
Barbadian
Albanian
Single Mother Poverty
Single Mother Poverty Comparison
Barbadians
Albanians
30.7%
SINGLE MOTHER POVERTY
1.3/ 100
METRIC RATING
245th/ 347
METRIC RANK
27.9%
SINGLE MOTHER POVERTY
97.6/ 100
METRIC RATING
94th/ 347
METRIC RANK
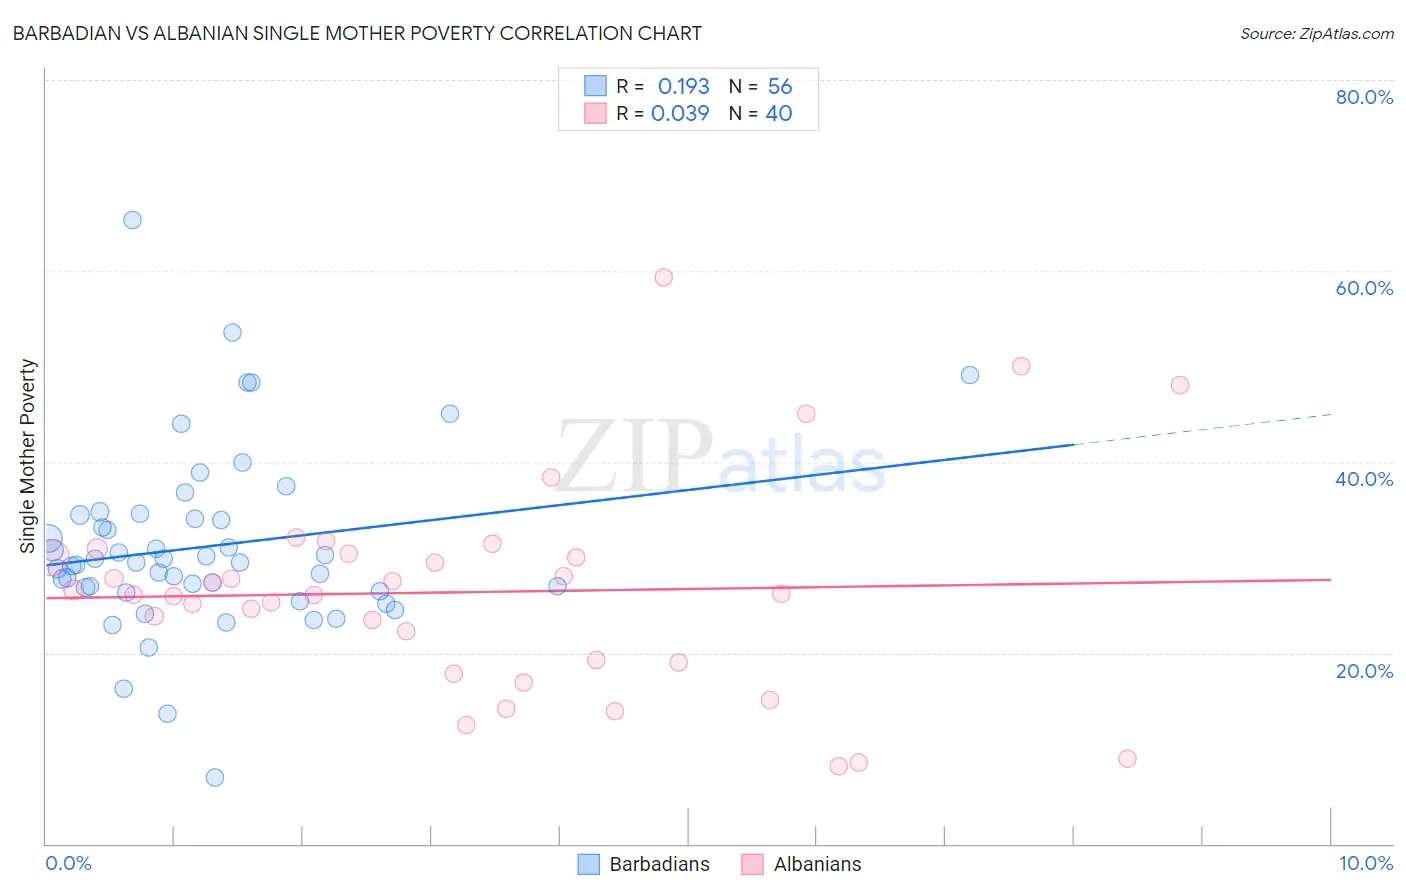
Barbadian vs Albanian Single Mother Poverty Correlation Chart
The statistical analysis conducted on geographies consisting of 140,210,705 people shows a poor positive correlation between the proportion of Barbadians and poverty level among single mothers in the United States with a correlation coefficient (R) of 0.193 and weighted average of 30.7%. Similarly, the statistical analysis conducted on geographies consisting of 189,512,988 people shows no correlation between the proportion of Albanians and poverty level among single mothers in the United States with a correlation coefficient (R) of 0.039 and weighted average of 27.9%, a difference of 10.0%.
Single Mother Poverty Correlation Summary
| Measurement | Barbadian | Albanian |
| Minimum | 6.9% | 8.1% |
| Maximum | 65.3% | 59.4% |
| Range | 58.4% | 51.3% |
| Mean | 31.1% | 26.4% |
| Median | 29.4% | 26.1% |
| Interquartile 25% (IQ1) | 26.6% | 19.1% |
| Interquartile 75% (IQ3) | 34.3% | 30.2% |
| Interquartile Range (IQR) | 7.6% | 11.1% |
| Standard Deviation (Sample) | 9.6% | 11.0% |
| Standard Deviation (Population) | 9.5% | 10.8% |
Similar Demographics by Single Mother Poverty
Demographics Similar to Barbadians by Single Mother Poverty
In terms of single mother poverty, the demographic groups most similar to Barbadians are French (30.7%, a difference of 0.010%), Bermudan (30.6%, a difference of 0.23%), Immigrants from Burma/Myanmar (30.6%, a difference of 0.31%), Immigrants from Laos (30.6%, a difference of 0.33%), and Salvadoran (30.6%, a difference of 0.38%).
| Demographics | Rating | Rank | Single Mother Poverty |
| Slovaks | 2.8 /100 | #238 | Tragic 30.4% |
| Immigrants | Portugal | 2.1 /100 | #239 | Tragic 30.5% |
| Salvadorans | 1.8 /100 | #240 | Tragic 30.6% |
| Immigrants | Laos | 1.8 /100 | #241 | Tragic 30.6% |
| Immigrants | Burma/Myanmar | 1.7 /100 | #242 | Tragic 30.6% |
| Bermudans | 1.6 /100 | #243 | Tragic 30.6% |
| French | 1.3 /100 | #244 | Tragic 30.7% |
| Barbadians | 1.3 /100 | #245 | Tragic 30.7% |
| Ecuadorians | 0.9 /100 | #246 | Tragic 30.8% |
| West Indians | 0.9 /100 | #247 | Tragic 30.8% |
| French Canadians | 0.9 /100 | #248 | Tragic 30.8% |
| Cape Verdeans | 0.8 /100 | #249 | Tragic 30.8% |
| Vietnamese | 0.7 /100 | #250 | Tragic 30.9% |
| Tlingit-Haida | 0.6 /100 | #251 | Tragic 30.9% |
| Alaska Natives | 0.6 /100 | #252 | Tragic 30.9% |
Demographics Similar to Albanians by Single Mother Poverty
In terms of single mother poverty, the demographic groups most similar to Albanians are Chilean (27.9%, a difference of 0.030%), Romanian (27.8%, a difference of 0.10%), Immigrants from Iraq (27.9%, a difference of 0.13%), Immigrants from Brazil (27.9%, a difference of 0.17%), and Immigrants from Nepal (27.9%, a difference of 0.18%).
| Demographics | Rating | Rank | Single Mother Poverty |
| Afghans | 98.5 /100 | #87 | Exceptional 27.7% |
| Ethiopians | 98.4 /100 | #88 | Exceptional 27.7% |
| Immigrants | Ethiopia | 98.4 /100 | #89 | Exceptional 27.7% |
| Immigrants | France | 98.2 /100 | #90 | Exceptional 27.8% |
| Immigrants | Albania | 98.0 /100 | #91 | Exceptional 27.8% |
| Estonians | 97.9 /100 | #92 | Exceptional 27.8% |
| Romanians | 97.8 /100 | #93 | Exceptional 27.8% |
| Albanians | 97.6 /100 | #94 | Exceptional 27.9% |
| Chileans | 97.5 /100 | #95 | Exceptional 27.9% |
| Immigrants | Iraq | 97.3 /100 | #96 | Exceptional 27.9% |
| Immigrants | Brazil | 97.2 /100 | #97 | Exceptional 27.9% |
| Immigrants | Nepal | 97.2 /100 | #98 | Exceptional 27.9% |
| Immigrants | Netherlands | 97.2 /100 | #99 | Exceptional 27.9% |
| Zimbabweans | 97.1 /100 | #100 | Exceptional 27.9% |
| Pakistanis | 96.9 /100 | #101 | Exceptional 28.0% |