Barbadian vs Czechoslovakian Unemployment
COMPARE
Barbadian
Czechoslovakian
Unemployment
Unemployment Comparison
Barbadians
Czechoslovakians
6.5%
UNEMPLOYMENT
0.0/ 100
METRIC RATING
308th/ 347
METRIC RANK
4.8%
UNEMPLOYMENT
99.7/ 100
METRIC RATING
37th/ 347
METRIC RANK
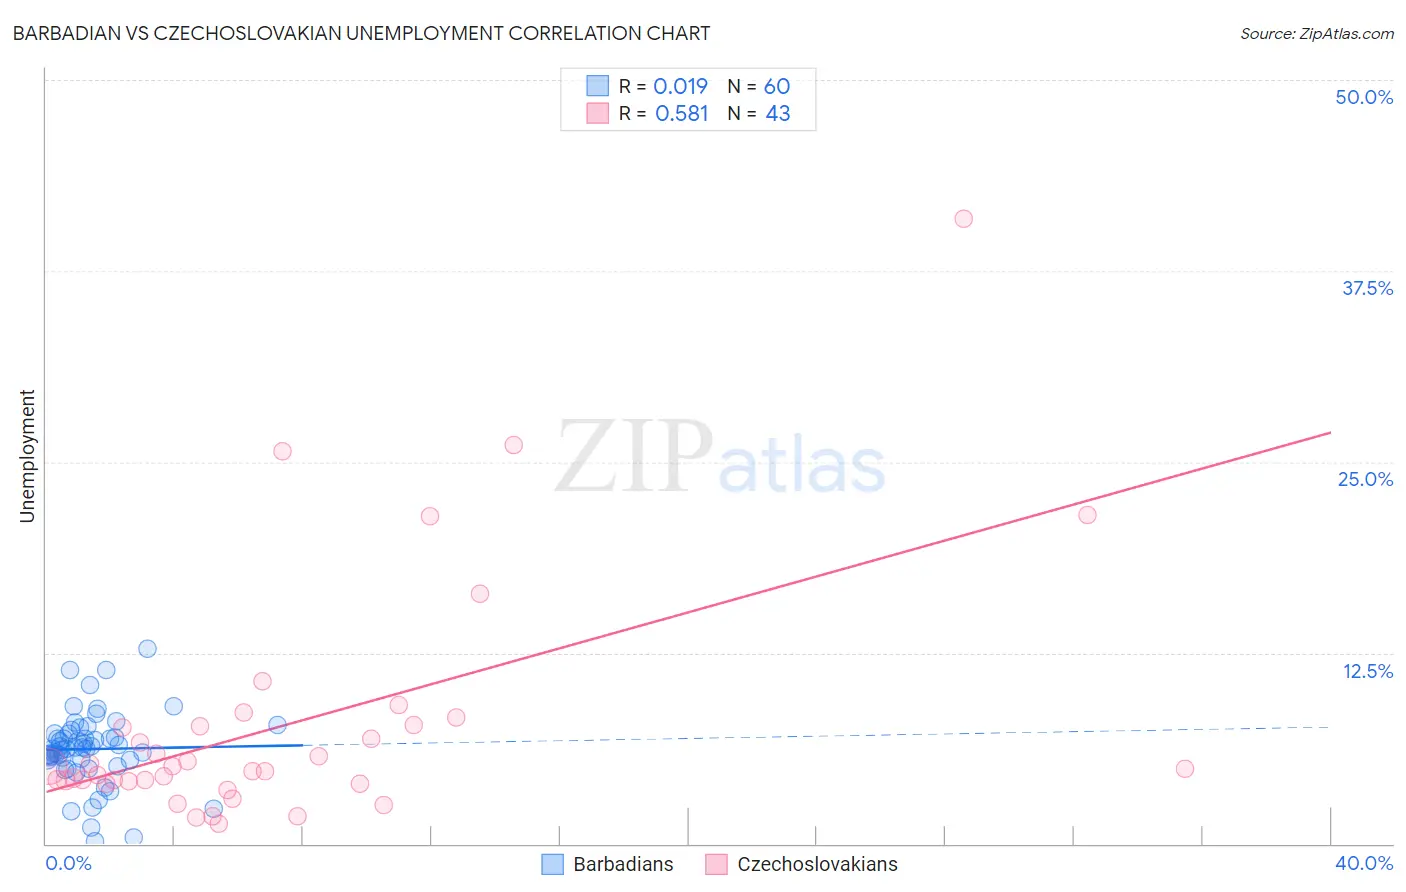
Barbadian vs Czechoslovakian Unemployment Correlation Chart
The statistical analysis conducted on geographies consisting of 141,269,105 people shows no correlation between the proportion of Barbadians and unemployment in the United States with a correlation coefficient (R) of 0.019 and weighted average of 6.5%. Similarly, the statistical analysis conducted on geographies consisting of 368,083,136 people shows a substantial positive correlation between the proportion of Czechoslovakians and unemployment in the United States with a correlation coefficient (R) of 0.581 and weighted average of 4.8%, a difference of 35.8%.
Unemployment Correlation Summary
| Measurement | Barbadian | Czechoslovakian |
| Minimum | 0.20% | 1.3% |
| Maximum | 12.8% | 40.9% |
| Range | 12.6% | 39.6% |
| Mean | 6.2% | 7.8% |
| Median | 6.3% | 4.9% |
| Interquartile 25% (IQ1) | 5.6% | 4.1% |
| Interquartile 75% (IQ3) | 7.2% | 7.8% |
| Interquartile Range (IQR) | 1.7% | 3.7% |
| Standard Deviation (Sample) | 2.4% | 8.0% |
| Standard Deviation (Population) | 2.4% | 7.9% |
Similar Demographics by Unemployment
Demographics Similar to Barbadians by Unemployment
In terms of unemployment, the demographic groups most similar to Barbadians are Vietnamese (6.5%, a difference of 0.010%), Immigrants from Belize (6.5%, a difference of 0.28%), Immigrants from Bangladesh (6.5%, a difference of 0.37%), Cape Verdean (6.5%, a difference of 0.61%), and Lumbee (6.4%, a difference of 0.86%).
| Demographics | Rating | Rank | Unemployment |
| Trinidadians and Tobagonians | 0.0 /100 | #301 | Tragic 6.3% |
| West Indians | 0.0 /100 | #302 | Tragic 6.4% |
| Belizeans | 0.0 /100 | #303 | Tragic 6.4% |
| Immigrants | Jamaica | 0.0 /100 | #304 | Tragic 6.4% |
| Menominee | 0.0 /100 | #305 | Tragic 6.4% |
| Lumbee | 0.0 /100 | #306 | Tragic 6.4% |
| Immigrants | Bangladesh | 0.0 /100 | #307 | Tragic 6.5% |
| Barbadians | 0.0 /100 | #308 | Tragic 6.5% |
| Vietnamese | 0.0 /100 | #309 | Tragic 6.5% |
| Immigrants | Belize | 0.0 /100 | #310 | Tragic 6.5% |
| Cape Verdeans | 0.0 /100 | #311 | Tragic 6.5% |
| Colville | 0.0 /100 | #312 | Tragic 6.6% |
| Immigrants | Barbados | 0.0 /100 | #313 | Tragic 6.6% |
| Blacks/African Americans | 0.0 /100 | #314 | Tragic 6.6% |
| Houma | 0.0 /100 | #315 | Tragic 6.7% |
Demographics Similar to Czechoslovakians by Unemployment
In terms of unemployment, the demographic groups most similar to Czechoslovakians are Tongan (4.8%, a difference of 0.070%), Bolivian (4.8%, a difference of 0.19%), Scotch-Irish (4.8%, a difference of 0.29%), Lithuanian (4.8%, a difference of 0.34%), and Northern European (4.8%, a difference of 0.35%).
| Demographics | Rating | Rank | Unemployment |
| Irish | 99.8 /100 | #30 | Exceptional 4.8% |
| Croatians | 99.8 /100 | #31 | Exceptional 4.8% |
| Zimbabweans | 99.8 /100 | #32 | Exceptional 4.8% |
| Sudanese | 99.8 /100 | #33 | Exceptional 4.8% |
| Immigrants | Bolivia | 99.8 /100 | #34 | Exceptional 4.8% |
| Scotch-Irish | 99.8 /100 | #35 | Exceptional 4.8% |
| Tongans | 99.7 /100 | #36 | Exceptional 4.8% |
| Czechoslovakians | 99.7 /100 | #37 | Exceptional 4.8% |
| Bolivians | 99.7 /100 | #38 | Exceptional 4.8% |
| Lithuanians | 99.7 /100 | #39 | Exceptional 4.8% |
| Northern Europeans | 99.7 /100 | #40 | Exceptional 4.8% |
| Immigrants | Bosnia and Herzegovina | 99.7 /100 | #41 | Exceptional 4.8% |
| Filipinos | 99.5 /100 | #42 | Exceptional 4.8% |
| Yugoslavians | 99.5 /100 | #43 | Exceptional 4.8% |
| Austrians | 99.5 /100 | #44 | Exceptional 4.8% |