Jamaican vs Czechoslovakian Single Mother Poverty
COMPARE
Jamaican
Czechoslovakian
Single Mother Poverty
Single Mother Poverty Comparison
Jamaicans
Czechoslovakians
29.9%
SINGLE MOTHER POVERTY
11.7/ 100
METRIC RATING
215th/ 347
METRIC RANK
29.7%
SINGLE MOTHER POVERTY
16.1/ 100
METRIC RATING
205th/ 347
METRIC RANK
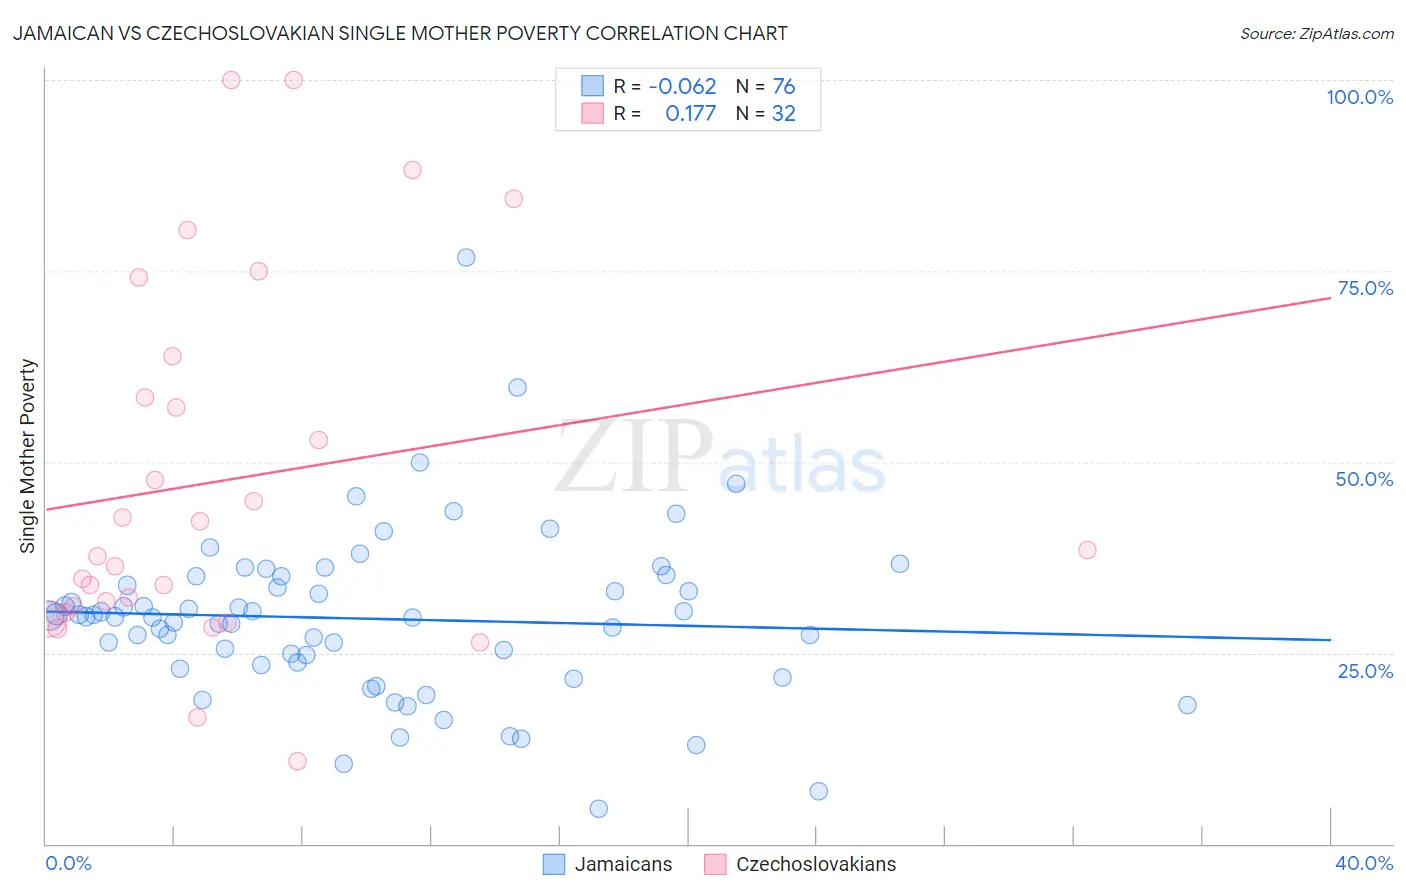
Jamaican vs Czechoslovakian Single Mother Poverty Correlation Chart
The statistical analysis conducted on geographies consisting of 360,593,795 people shows a slight negative correlation between the proportion of Jamaicans and poverty level among single mothers in the United States with a correlation coefficient (R) of -0.062 and weighted average of 29.9%. Similarly, the statistical analysis conducted on geographies consisting of 358,570,470 people shows a poor positive correlation between the proportion of Czechoslovakians and poverty level among single mothers in the United States with a correlation coefficient (R) of 0.177 and weighted average of 29.7%, a difference of 0.44%.
Single Mother Poverty Correlation Summary
| Measurement | Jamaican | Czechoslovakian |
| Minimum | 4.6% | 10.8% |
| Maximum | 76.7% | 100.0% |
| Range | 72.1% | 89.2% |
| Mean | 29.5% | 47.5% |
| Median | 29.7% | 38.1% |
| Interquartile 25% (IQ1) | 23.5% | 30.7% |
| Interquartile 75% (IQ3) | 34.4% | 61.2% |
| Interquartile Range (IQR) | 10.9% | 30.4% |
| Standard Deviation (Sample) | 11.0% | 23.9% |
| Standard Deviation (Population) | 11.0% | 23.5% |
Demographics Similar to Jamaicans and Czechoslovakians by Single Mother Poverty
In terms of single mother poverty, the demographic groups most similar to Jamaicans are Liberian (29.9%, a difference of 0.0%), Immigrants from Western Africa (29.9%, a difference of 0.020%), Immigrants from Thailand (29.9%, a difference of 0.030%), Immigrants from Ghana (29.9%, a difference of 0.040%), and Nicaraguan (29.8%, a difference of 0.080%). Similarly, the demographic groups most similar to Czechoslovakians are Immigrants from Haiti (29.7%, a difference of 0.020%), Immigrants (29.7%, a difference of 0.040%), Immigrants from Panama (29.8%, a difference of 0.050%), Swiss (29.7%, a difference of 0.10%), and Malaysian (29.7%, a difference of 0.11%).
| Demographics | Rating | Rank | Single Mother Poverty |
| Panamanians | 20.0 /100 | #200 | Fair 29.6% |
| Belgians | 18.8 /100 | #201 | Poor 29.7% |
| Malaysians | 17.4 /100 | #202 | Poor 29.7% |
| Swiss | 17.2 /100 | #203 | Poor 29.7% |
| Immigrants | Immigrants | 16.6 /100 | #204 | Poor 29.7% |
| Czechoslovakians | 16.1 /100 | #205 | Poor 29.7% |
| Immigrants | Haiti | 15.8 /100 | #206 | Poor 29.7% |
| Immigrants | Panama | 15.5 /100 | #207 | Poor 29.8% |
| Immigrants | Guyana | 14.7 /100 | #208 | Poor 29.8% |
| Irish | 13.9 /100 | #209 | Poor 29.8% |
| Haitians | 13.3 /100 | #210 | Poor 29.8% |
| Guyanese | 12.8 /100 | #211 | Poor 29.8% |
| Nicaraguans | 12.4 /100 | #212 | Poor 29.8% |
| Immigrants | Thailand | 12.0 /100 | #213 | Poor 29.9% |
| Liberians | 11.7 /100 | #214 | Poor 29.9% |
| Jamaicans | 11.7 /100 | #215 | Poor 29.9% |
| Immigrants | Western Africa | 11.5 /100 | #216 | Poor 29.9% |
| Immigrants | Ghana | 11.3 /100 | #217 | Poor 29.9% |
| Hungarians | 10.3 /100 | #218 | Poor 29.9% |
| Finns | 9.3 /100 | #219 | Tragic 30.0% |
| Germans | 8.8 /100 | #220 | Tragic 30.0% |