Barbadian vs Soviet Union Single Mother Poverty
COMPARE
Barbadian
Soviet Union
Single Mother Poverty
Single Mother Poverty Comparison
Barbadians
Soviet Union
30.7%
SINGLE MOTHER POVERTY
1.3/ 100
METRIC RATING
245th/ 347
METRIC RANK
27.3%
SINGLE MOTHER POVERTY
99.5/ 100
METRIC RATING
66th/ 347
METRIC RANK
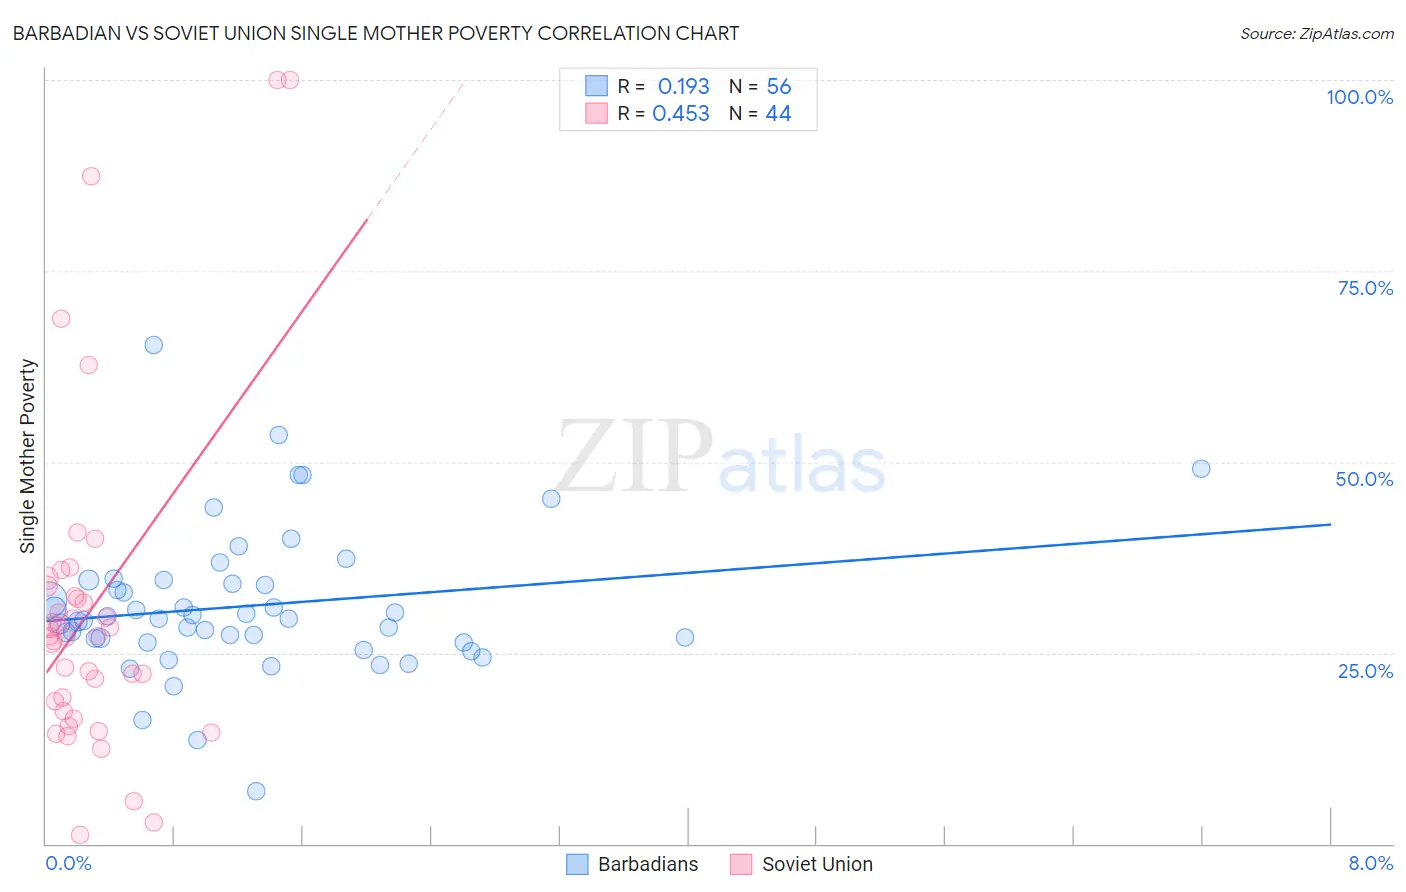
Barbadian vs Soviet Union Single Mother Poverty Correlation Chart
The statistical analysis conducted on geographies consisting of 140,210,705 people shows a poor positive correlation between the proportion of Barbadians and poverty level among single mothers in the United States with a correlation coefficient (R) of 0.193 and weighted average of 30.7%. Similarly, the statistical analysis conducted on geographies consisting of 43,309,849 people shows a moderate positive correlation between the proportion of Soviet Union and poverty level among single mothers in the United States with a correlation coefficient (R) of 0.453 and weighted average of 27.3%, a difference of 12.2%.
Single Mother Poverty Correlation Summary
| Measurement | Barbadian | Soviet Union |
| Minimum | 6.9% | 1.1% |
| Maximum | 65.3% | 100.0% |
| Range | 58.4% | 98.9% |
| Mean | 31.1% | 30.7% |
| Median | 29.4% | 27.2% |
| Interquartile 25% (IQ1) | 26.6% | 18.1% |
| Interquartile 75% (IQ3) | 34.3% | 33.0% |
| Interquartile Range (IQR) | 7.6% | 15.0% |
| Standard Deviation (Sample) | 9.6% | 21.9% |
| Standard Deviation (Population) | 9.5% | 21.6% |
Similar Demographics by Single Mother Poverty
Demographics Similar to Barbadians by Single Mother Poverty
In terms of single mother poverty, the demographic groups most similar to Barbadians are French (30.7%, a difference of 0.010%), Bermudan (30.6%, a difference of 0.23%), Immigrants from Burma/Myanmar (30.6%, a difference of 0.31%), Immigrants from Laos (30.6%, a difference of 0.33%), and Salvadoran (30.6%, a difference of 0.38%).
| Demographics | Rating | Rank | Single Mother Poverty |
| Slovaks | 2.8 /100 | #238 | Tragic 30.4% |
| Immigrants | Portugal | 2.1 /100 | #239 | Tragic 30.5% |
| Salvadorans | 1.8 /100 | #240 | Tragic 30.6% |
| Immigrants | Laos | 1.8 /100 | #241 | Tragic 30.6% |
| Immigrants | Burma/Myanmar | 1.7 /100 | #242 | Tragic 30.6% |
| Bermudans | 1.6 /100 | #243 | Tragic 30.6% |
| French | 1.3 /100 | #244 | Tragic 30.7% |
| Barbadians | 1.3 /100 | #245 | Tragic 30.7% |
| Ecuadorians | 0.9 /100 | #246 | Tragic 30.8% |
| West Indians | 0.9 /100 | #247 | Tragic 30.8% |
| French Canadians | 0.9 /100 | #248 | Tragic 30.8% |
| Cape Verdeans | 0.8 /100 | #249 | Tragic 30.8% |
| Vietnamese | 0.7 /100 | #250 | Tragic 30.9% |
| Tlingit-Haida | 0.6 /100 | #251 | Tragic 30.9% |
| Alaska Natives | 0.6 /100 | #252 | Tragic 30.9% |
Demographics Similar to Soviet Union by Single Mother Poverty
In terms of single mother poverty, the demographic groups most similar to Soviet Union are Immigrants from Australia (27.3%, a difference of 0.020%), Immigrants from Turkey (27.3%, a difference of 0.040%), Immigrants from Czechoslovakia (27.4%, a difference of 0.050%), Russian (27.3%, a difference of 0.12%), and Immigrants from Northern Europe (27.3%, a difference of 0.15%).
| Demographics | Rating | Rank | Single Mother Poverty |
| Paraguayans | 99.6 /100 | #59 | Exceptional 27.2% |
| Eastern Europeans | 99.6 /100 | #60 | Exceptional 27.2% |
| Immigrants | Eastern Europe | 99.6 /100 | #61 | Exceptional 27.2% |
| Immigrants | Malaysia | 99.5 /100 | #62 | Exceptional 27.3% |
| Immigrants | Northern Europe | 99.5 /100 | #63 | Exceptional 27.3% |
| Russians | 99.5 /100 | #64 | Exceptional 27.3% |
| Immigrants | Turkey | 99.5 /100 | #65 | Exceptional 27.3% |
| Soviet Union | 99.5 /100 | #66 | Exceptional 27.3% |
| Immigrants | Australia | 99.5 /100 | #67 | Exceptional 27.3% |
| Immigrants | Czechoslovakia | 99.5 /100 | #68 | Exceptional 27.4% |
| Lithuanians | 99.4 /100 | #69 | Exceptional 27.4% |
| Immigrants | Belarus | 99.4 /100 | #70 | Exceptional 27.4% |
| Macedonians | 99.4 /100 | #71 | Exceptional 27.4% |
| Immigrants | Russia | 99.4 /100 | #72 | Exceptional 27.4% |
| Sierra Leoneans | 99.3 /100 | #73 | Exceptional 27.4% |