Barbadian vs Czechoslovakian Seniors Poverty Over the Age of 65
COMPARE
Barbadian
Czechoslovakian
Seniors Poverty Over the Age of 65
Seniors Poverty Over the Age of 65 Comparison
Barbadians
Czechoslovakians
14.4%
SENIORS POVERTY OVER THE AGE OF 65
0.0/ 100
METRIC RATING
313th/ 347
METRIC RANK
9.5%
SENIORS POVERTY OVER THE AGE OF 65
99.8/ 100
METRIC RATING
36th/ 347
METRIC RANK
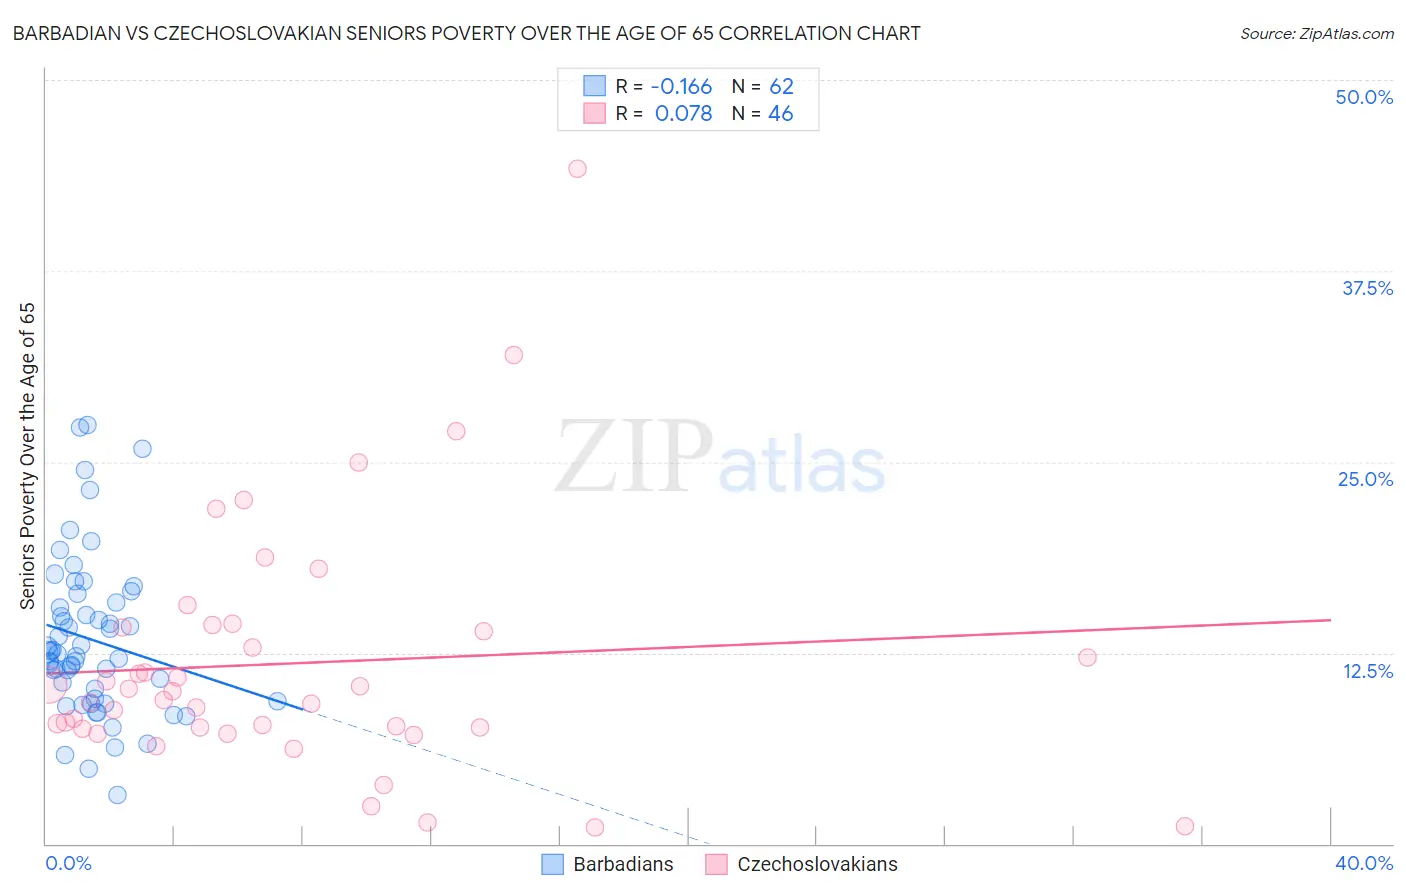
Barbadian vs Czechoslovakian Seniors Poverty Over the Age of 65 Correlation Chart
The statistical analysis conducted on geographies consisting of 141,112,181 people shows a poor negative correlation between the proportion of Barbadians and poverty level among seniors over the age of 65 in the United States with a correlation coefficient (R) of -0.166 and weighted average of 14.4%. Similarly, the statistical analysis conducted on geographies consisting of 367,521,017 people shows a slight positive correlation between the proportion of Czechoslovakians and poverty level among seniors over the age of 65 in the United States with a correlation coefficient (R) of 0.078 and weighted average of 9.5%, a difference of 51.9%.
Seniors Poverty Over the Age of 65 Correlation Summary
| Measurement | Barbadian | Czechoslovakian |
| Minimum | 3.2% | 1.1% |
| Maximum | 27.4% | 44.2% |
| Range | 24.2% | 43.1% |
| Mean | 13.4% | 11.8% |
| Median | 12.5% | 9.7% |
| Interquartile 25% (IQ1) | 9.5% | 7.6% |
| Interquartile 75% (IQ3) | 15.8% | 14.2% |
| Interquartile Range (IQR) | 6.3% | 6.6% |
| Standard Deviation (Sample) | 5.2% | 8.2% |
| Standard Deviation (Population) | 5.1% | 8.1% |
Similar Demographics by Seniors Poverty Over the Age of 65
Demographics Similar to Barbadians by Seniors Poverty Over the Age of 65
In terms of seniors poverty over the age of 65, the demographic groups most similar to Barbadians are Hispanic or Latino (14.3%, a difference of 0.37%), Guyanese (14.4%, a difference of 0.39%), Immigrants from Ecuador (14.4%, a difference of 0.43%), Immigrants from Guyana (14.5%, a difference of 0.64%), and Haitian (14.5%, a difference of 0.67%).
| Demographics | Rating | Rank | Seniors Poverty Over the Age of 65 |
| Immigrants | Latin America | 0.0 /100 | #306 | Tragic 14.2% |
| Immigrants | West Indies | 0.0 /100 | #307 | Tragic 14.2% |
| Trinidadians and Tobagonians | 0.0 /100 | #308 | Tragic 14.2% |
| Hondurans | 0.0 /100 | #309 | Tragic 14.2% |
| Bahamians | 0.0 /100 | #310 | Tragic 14.2% |
| Natives/Alaskans | 0.0 /100 | #311 | Tragic 14.2% |
| Hispanics or Latinos | 0.0 /100 | #312 | Tragic 14.3% |
| Barbadians | 0.0 /100 | #313 | Tragic 14.4% |
| Guyanese | 0.0 /100 | #314 | Tragic 14.4% |
| Immigrants | Ecuador | 0.0 /100 | #315 | Tragic 14.4% |
| Immigrants | Guyana | 0.0 /100 | #316 | Tragic 14.5% |
| Haitians | 0.0 /100 | #317 | Tragic 14.5% |
| Immigrants | Honduras | 0.0 /100 | #318 | Tragic 14.5% |
| Cape Verdeans | 0.0 /100 | #319 | Tragic 14.7% |
| Immigrants | Haiti | 0.0 /100 | #320 | Tragic 14.7% |
Demographics Similar to Czechoslovakians by Seniors Poverty Over the Age of 65
In terms of seniors poverty over the age of 65, the demographic groups most similar to Czechoslovakians are Latvian (9.5%, a difference of 0.050%), British (9.4%, a difference of 0.43%), Scotch-Irish (9.5%, a difference of 0.50%), Belgian (9.5%, a difference of 0.52%), and Native Hawaiian (9.4%, a difference of 0.53%).
| Demographics | Rating | Rank | Seniors Poverty Over the Age of 65 |
| Bhutanese | 99.9 /100 | #29 | Exceptional 9.3% |
| Menominee | 99.8 /100 | #30 | Exceptional 9.4% |
| Finns | 99.8 /100 | #31 | Exceptional 9.4% |
| Northern Europeans | 99.8 /100 | #32 | Exceptional 9.4% |
| Native Hawaiians | 99.8 /100 | #33 | Exceptional 9.4% |
| British | 99.8 /100 | #34 | Exceptional 9.4% |
| Latvians | 99.8 /100 | #35 | Exceptional 9.5% |
| Czechoslovakians | 99.8 /100 | #36 | Exceptional 9.5% |
| Scotch-Irish | 99.7 /100 | #37 | Exceptional 9.5% |
| Belgians | 99.7 /100 | #38 | Exceptional 9.5% |
| Greeks | 99.6 /100 | #39 | Exceptional 9.6% |
| Assyrians/Chaldeans/Syriacs | 99.6 /100 | #40 | Exceptional 9.6% |
| Immigrants | North Macedonia | 99.6 /100 | #41 | Exceptional 9.6% |
| Zimbabweans | 99.6 /100 | #42 | Exceptional 9.6% |
| Eastern Europeans | 99.6 /100 | #43 | Exceptional 9.6% |